
Index Greeks H1 2026
This article reviews the Greek sensitivities for structured products linked to selected equity indices over the first six months of 2026. The charts show how these sensitivities evolved across major indices, including the Dow Jones Industrial Average, EURO STOXX 50, FTSE 100, Hang Seng China Enterprises Index, KOSPI 200, Nasdaq 100, Nikkei 225, Russell 2000 and S&P 500.
The portfolio was dominated by the S&P 500 during the first half of 2026, with EURO STOXX 50 and Russell 2000 representing the next most important exposures. The charts show that the main sensitivities rose in magnitude toward March, reduced as markets recovered, and then stabilised or increased again toward the end of June. This pattern is consistent with the wider market backdrop, in which US equities weakened in the first quarter before rebounding strongly in the second quarter.
The market backdrop helps explain the patterns observed in the charts. The S&P 500 was positive overall during the first half of 2026, although its performance was uneven. The market weakened into March before rebounding strongly during the second quarter. Volatility also rose during the March market decline before falling back as markets recovered. This helps explain why some of the sensitivities increased in magnitude into late March and early April before reducing later in the period.
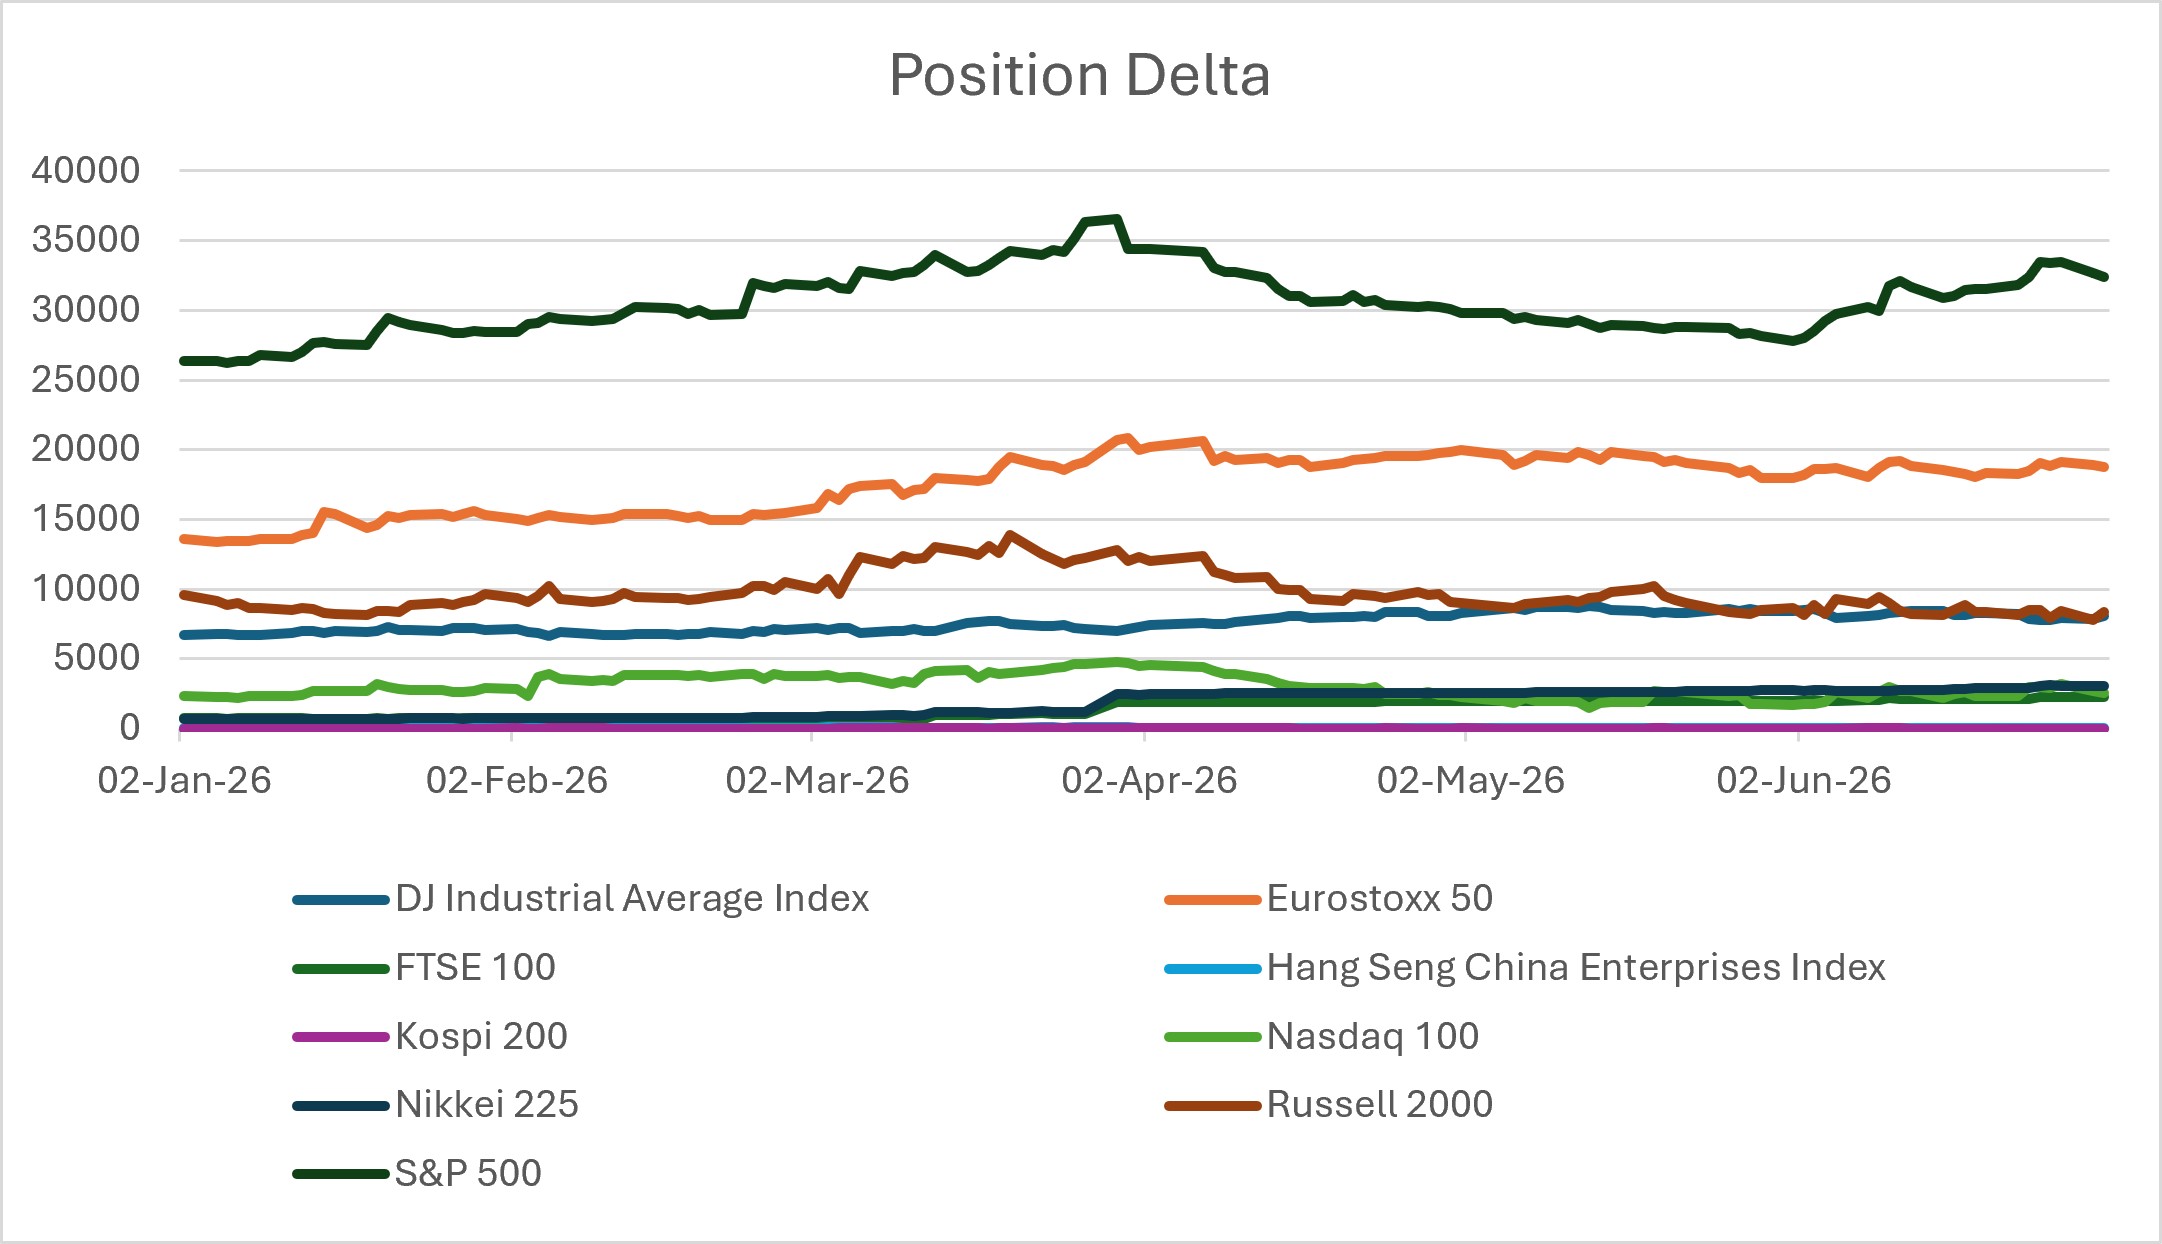
The Position Delta chart gives the clearest view of the portfolio's directional risk. The S&P 500 is consistently the largest exposure. Position Delta rises sharply towards late March, reduces through April and May, and then increases again towards the end of June. This broadly aligns with the market path. As the S&P 500 fell during the first quarter, some products would have moved closer to key product levels, such as autocall, coupon or barrier thresholds, increasing their sensitivity to further market movements. As the market recovered, some of this sensitivity reduced.
The EURO STOXX 50 index is the second-largest contributor to Position Delta and follows a similar pattern, increasing through the first quarter before reducing from its peak. The Russell 2000 is also significant, particularly earlier in the period, but becomes less dominant later on. The DJ Industrial Average sits below these larger exposures, while the Nasdaq 100, FTSE 100, Nikkei 225, KOSPI 200 and Hang Seng China Enterprises Index have considerably smaller Position Delta basis.
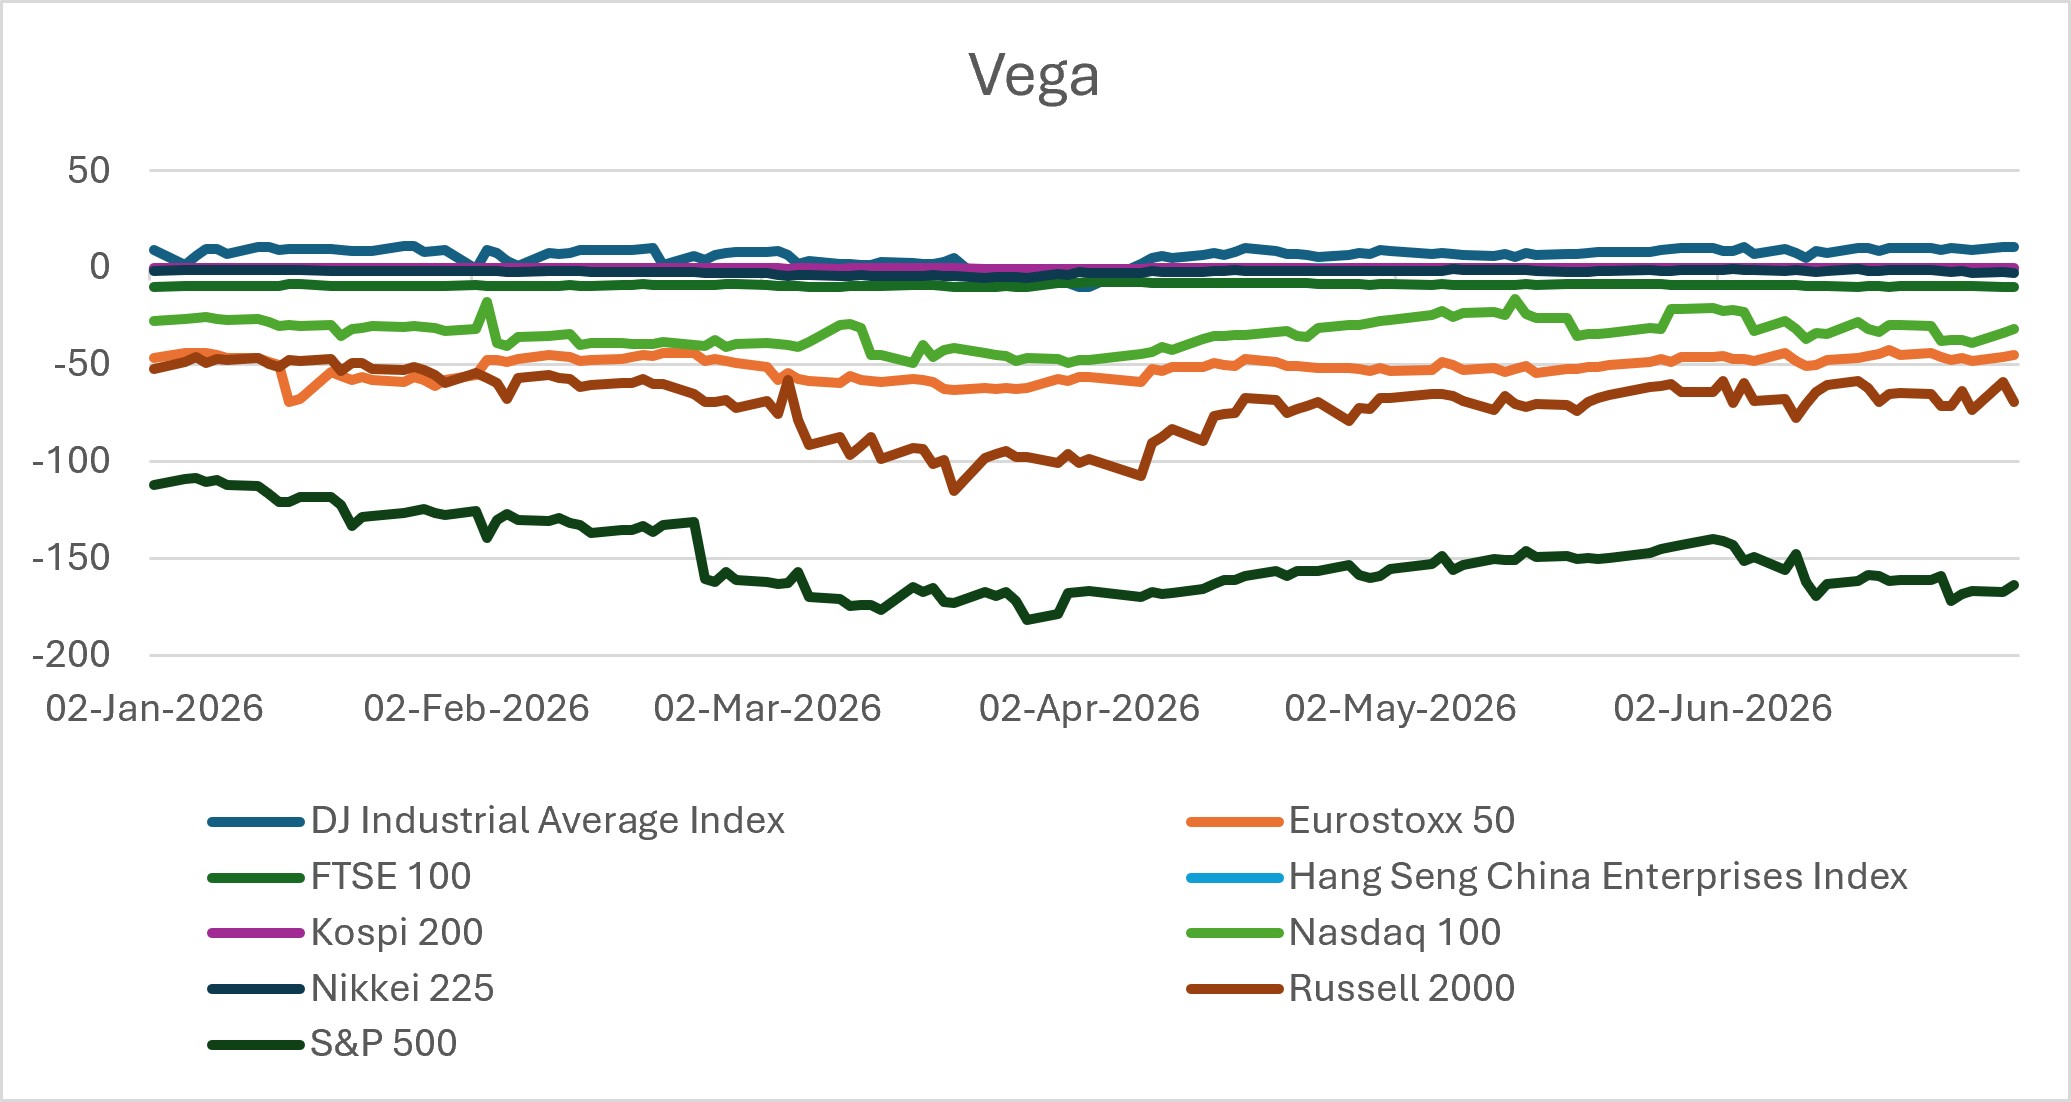
Vega is negative across the main index exposures, indicating that the portfolio is exposed to changes in implied volatility, with increases in volatility reducing overall valuations. The S&P 500 again stands out as the largest exposure. Its Vega becomes more negative during the first quarter, reduces in magnitude during April and May, and then becomes slightly more negative again towards the end of June. This broadly follows the same risk cycle as Position Delta, but with the opposite sign.
The wider volatility backdrop supports this interpretation. Volatility rose during the market weakness in March, coinciding with a period when the portfolio’s negative Vega was also more pronounced. As markets recovered and volatility declined during the second quarter, the magnitude of Vega reduced. This does not mean that changes in Vega movement were driven solely by market volatility, but the overall pattern is consistent with the market environment.
One notable exception is the DJ Industrial Average, which maintains positive Vega throughout most of the period, in contrast to the negative Vega observed across the other major indices. This appears to be partly attributable to product structure. While many S&P 500 products are linked solely to that index, DJIA is more commonly included in worst-of baskets. An examination of the largest DJIA-linked products by notional value shows that negative Vega individually. However, a smaller number of products, particularly those with uncapped accelerated or buffered-return structures, contribute relatively large amounts of positive Vega. This highlights how the combination of product payoff and basket composition can produce very different volatility sensitivities across individual indices.
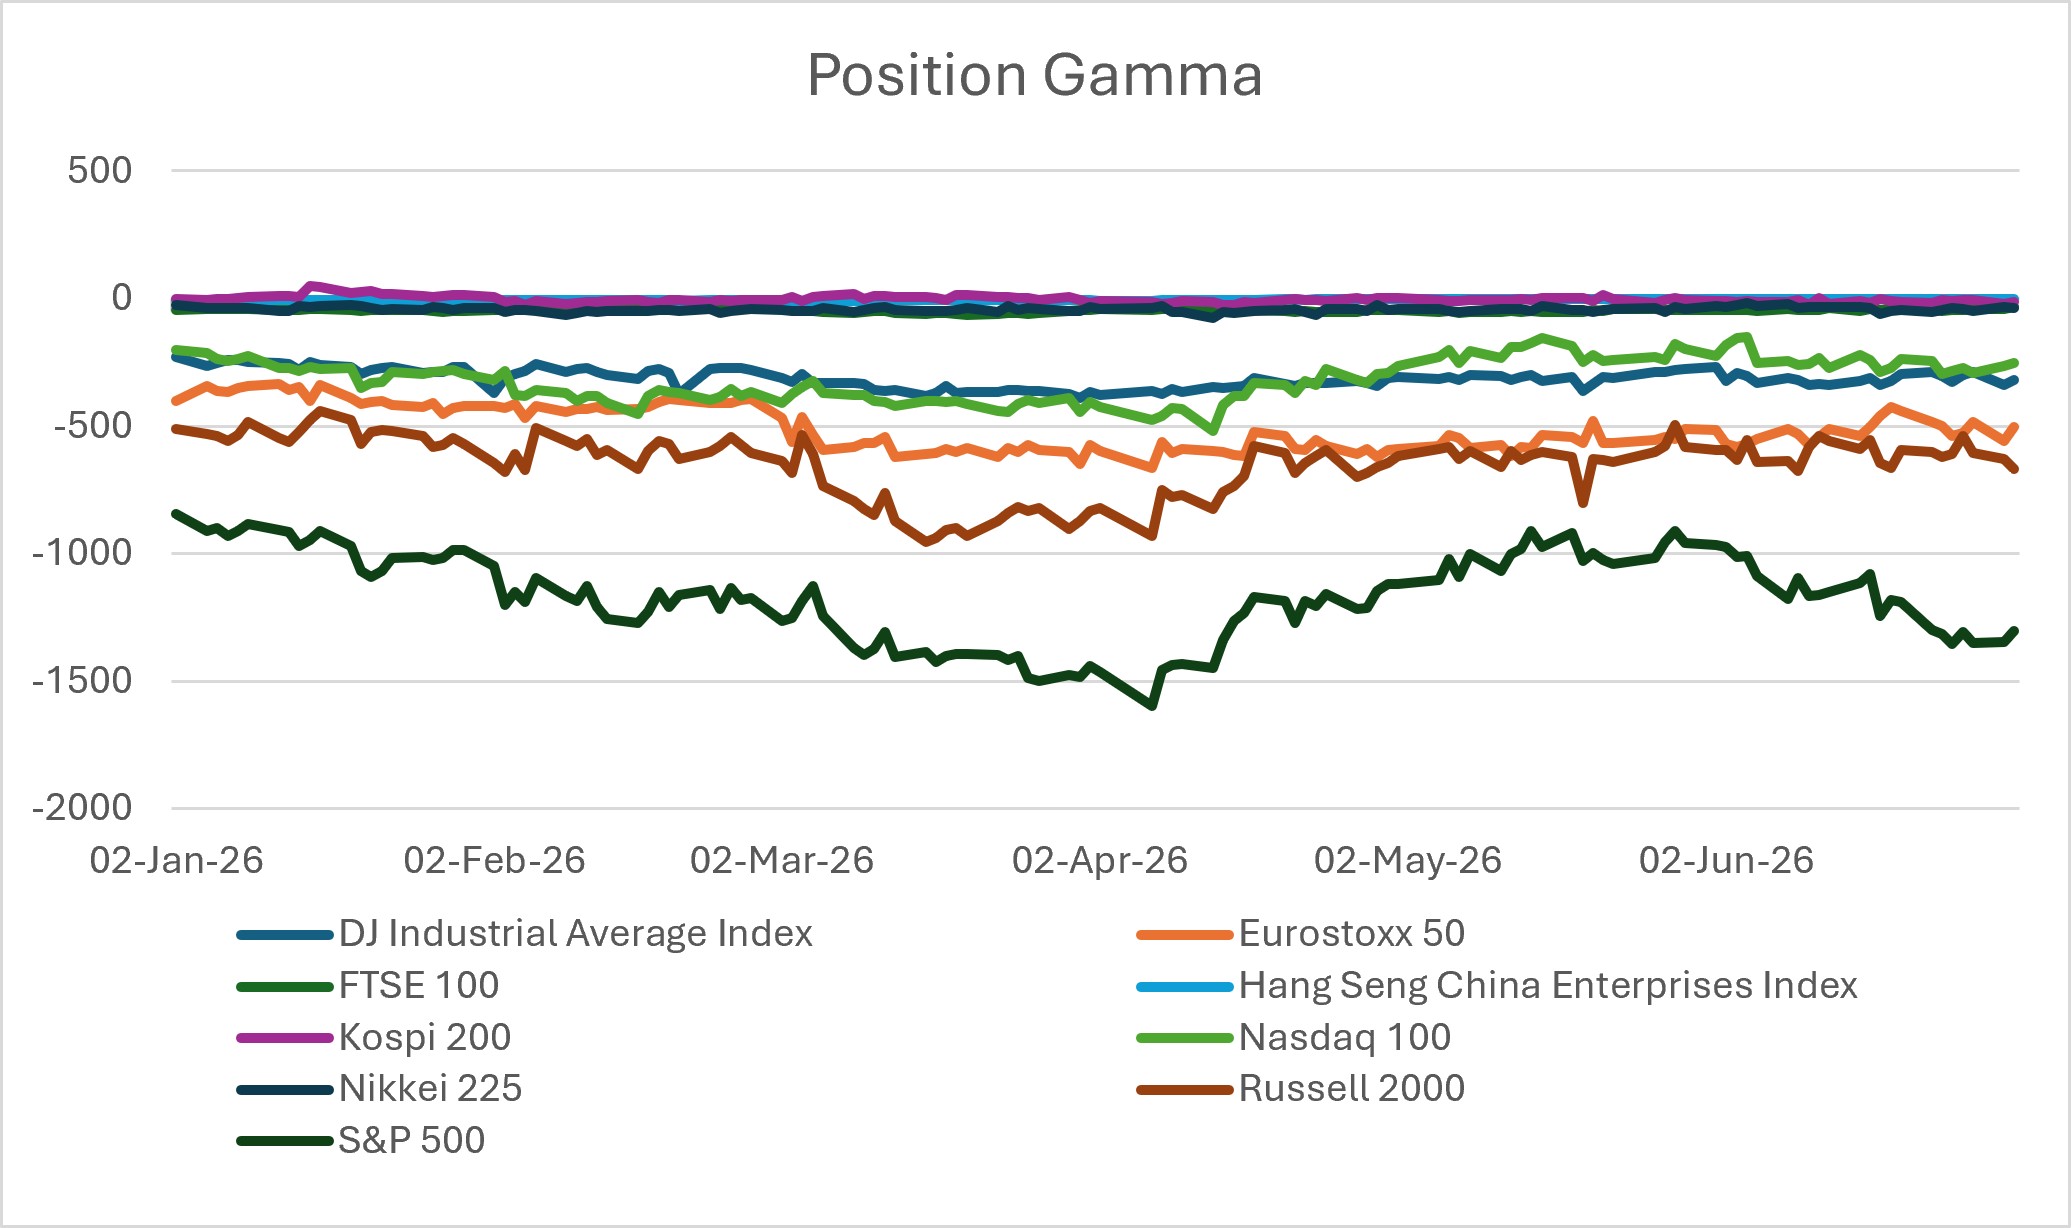
Position Gamma is negative across the main exposures and is dominated by the S&P 500. Negative Gamma is important because it shows that the portfolio’s directional exposure can change as markets move. In a structured products portfolio, this effect can become particularly relevant when underlying indices move closer to or further away from key product levels. The EURO STOXX 50 and Russell 2000 also have meaningful Position Gamma exposures, but the S&P 500 remains by far the largest contributor.
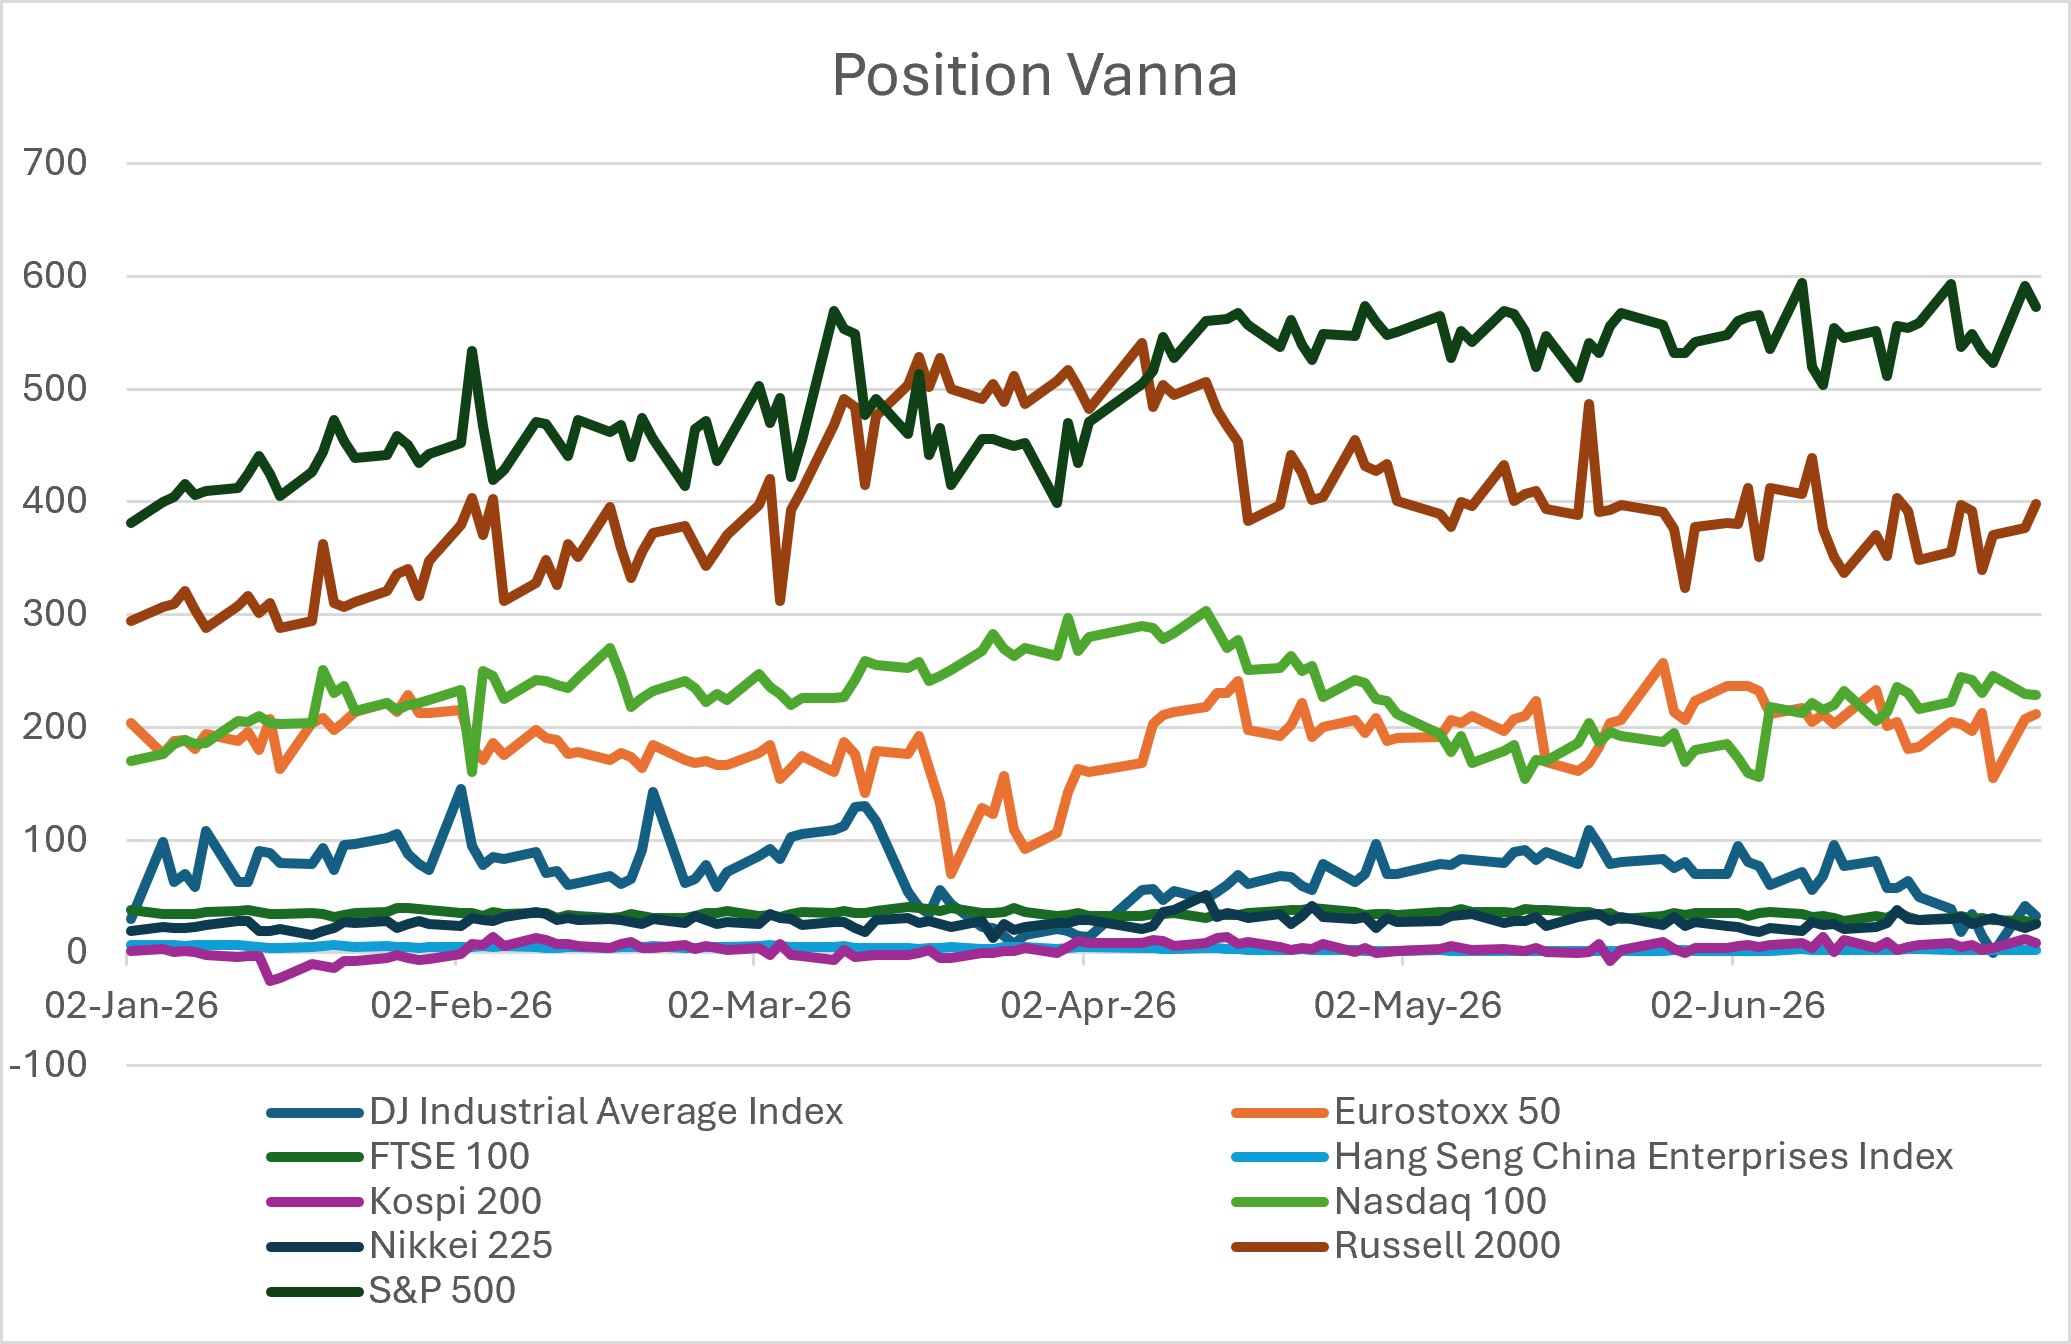
Position Vanna adds a further layer of analysis by capturing the interaction between movements in the underlying and changes in volatility. The S&P 500 is again the largest contributor, with the Russell 2000 also remaining consistently important. The Nasdaq 100 and EURO STOXX 50 are the next most relevant indices for this measure. This is important because the portfolio’s sensitivity is not determined solely by market direction or volatility in isolation. For the largest index exposures, the relationship between market movements and changes in volatility also matters.
The combined reading of the charts show that the portfolio remains concentrated in a relatively small number of indices. The S&P 500 is the key risk driver across directional, volatility and second-order sensitivities. The EURO STOXX 50 provides the main European contribution, while Russell 2000 is also important, particularly for Vega and Vanna. The Nasdaq 100 contributes more meaningfully to volatility-related measures than to Position Delta, while the remaining indices play a secondary role in the overall risk profile.
For risk-monitoring purposes, the S&P 500 is the key underlying to watch. The EURO STOXX 50 and Russell 2000 should also be monitored closely, while Nasdaq 100 warrants attention for its volatility-related sensitivities. The charts demonstrate the value of monitoring different Greeks over time. Although a portfolio may be linked to a broad range of indices, the Greeks reveal where its economic sensitivities are concentrated and how they evolve as markets, volatility and product positions change.
Tags: ValuationsImage courtesy of: Matteo Ulisse / unsplash.com