
Peak Vega
Vega is one of the core option Greeks, measuring how sensitive an option’s price is to changes in implied volatility. For structured products or portfolios exposed to volatility changes whether in equities, FX, rates, or commodities, Vega plays a central role in risk management, pricing, and strategy design.
Within any option’s life, there is a point at which its sensitivity to volatility reaches its maximum. This point is known as Peak Vega. Peak Vega refers to the combination of time to maturity and moneyness at which an option displays the highest sensitivity to implied volatility. Around this point, even minor shifts in implied volatility can lead to large moves in option value.
For a portfolio of structured products, Vega shows how sensitive the whole portfolio is to changes in implied volatility. Each product may contain the equivalent of several options with different strikes, maturities, and barrier features, so when all of these are combined the overall Vega profile is more complicated than for a single option. Certain maturities or market levels will have more exposure, and often one point stands out as the place where the product is most affected by volatility. This is the product’s Peak Vega. To a greater extent than for a single product, Peak Vega in a portfolio of products does not come from one strike or one tenor, but from the interaction of all the different structures within the portfolio.
Autocalls and income autocalls dominate the eligible products universe, but their Peak Vega behaves differently because the source of volatility sensitivity is not the same. In a standard autocall, volatility mainly affects the chance of early redemption. Peak Vega appears when the product is out of the money but still close enough to the trigger that a wider distribution could push it over the call level on the next observation date. When the product is comfortably in the money and likely to call, volatility has little influence and so vega is reduced.
In an income autocall, coupons often continue to be paid even when the product is out of the money because of a lower coupon barrier, so price is less impacted by whether it redeems and more impacted by the expected value and duration of future income. This usually shifts Peak Vega further out in maturity and makes it lower and smoother than in a standard autocall. When the underlying is well below the trigger, volatility becomes important again because it affects both the chance of a later call and how long the coupons might continue. In practice, income autocalls show a broader, flatter vega profile, while standard autocalls show a sharper peak around the point where early redemption is genuinely uncertain.
FVC analysis refers to a single scalar Vega that means that the same volatility shift is applied across all time points of the curve. Vega can also be broken down into time buckets by changing volatility for each time point on the curve in turn to give a view of the sensitivity to shifts in volatility over time.
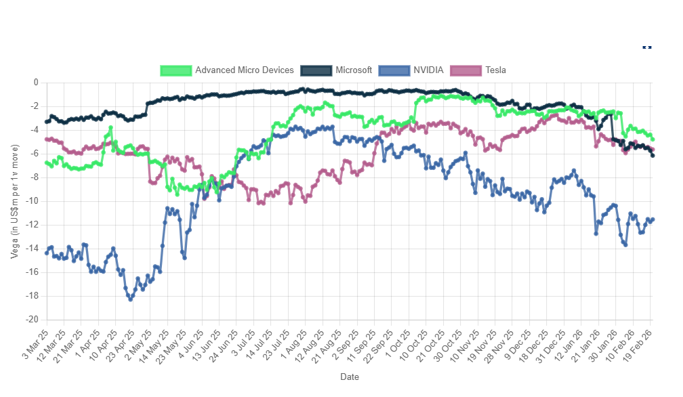
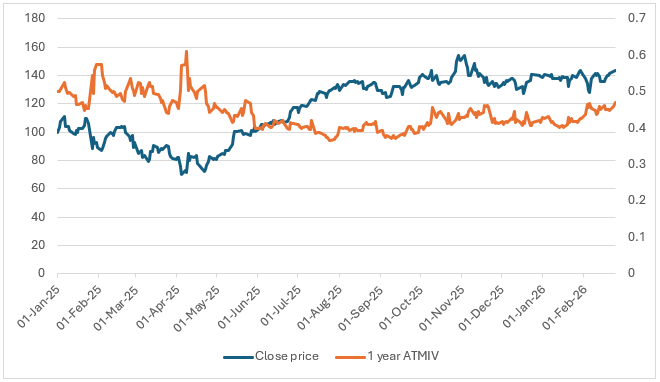
The chart shows that the Vega in this portfolio is consistently negative across all four names, with a clear concentration in NVIDIA and, to a lesser extent, AMD and Tesla. Microsoft stays close to flat, so contributes little to overall volatility risk. The deepest and most persistent short Vega appears in NVIDIA around April 2025, which effectively marks the portfolio’s Peak Vega period. This is where a rise in implied volatility would have had the largest negative impact on the NVIDIA portfolio valuation, before the exposure gradually reduces into early 2026. At the Peak Vega point NVIDIA stock price was at its lowest point of 2025 and there was a spike in implied volatility as shown in Figure 2. Both these factors and product conditions such as upcoming maturities and therefore potential barrier breaches or upcoming autocall/income triggers would lead to the increase in Vega observed.
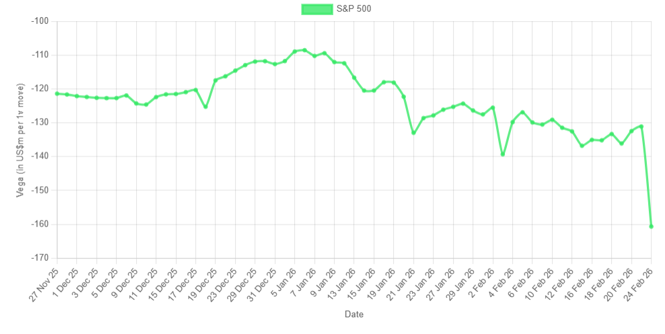
The S&P 500 Vega chart shows the portfolio’s volatility sensitivity increasing significantly from January onwards, with a sharp spike on 24 February where Vega reaches its highest magnitude of the year so far. There were several S&P linked trades with large notional added to the portfolio on this date which will account for a small portion of this spike. However, for the most part this is due to increase in Vega for products as they approach key dates or levels. The top 5 products by notional linked to the S&P 500 account for 2% of the Vega whilst the top 100 account for 18%. Changes in these large notional product will have a big effect on the overall portfolio sensitivities. Whether this is peak Vega for this underlying is not clear but it indicates that for the portfolio of S&P products sensitivity to volatility is currently high so any changes in implied volatility will have a big impact on the portfolio.
Peak Vega highlights the moment when a structured product portfolio is most exposed to changes in volatility. Because the optionality inside these products evolves as markets move and as observation dates approach, the point of maximum sensitivity naturally shifts. Tracking Peak Vega provides a simple way to see where volatility risk is concentrated at any given time and how that concentration moves as products age and new issuance enters the portfolio.
This article was generated from data coming from the SRP Greeks application, a service which provides aggregate Greeks data on important underlyings in structured product markets. The product set is taken from the SRP database and all calculations and analytics are powered by FVC. For more information contact www.structuredretailproducts.com. Tags: ValuationsImage courtesy of: João Marcelo Martins / unsplash.com