

UK Market 2026 Half Year Performance Review
The following data on the first two quarters in 2026 comes from FVC’s Structured Edge (www.structurededge.co.uk) which has now expanded its capabilities in the UK market. This includes detailed lifecycle data and performance analysis. The quarterly reports for Q1 and Q2 2026 help to provide a useful comparison of current activity in the UK retail structured products market up to the mid-point of 2026.
Product Maturities
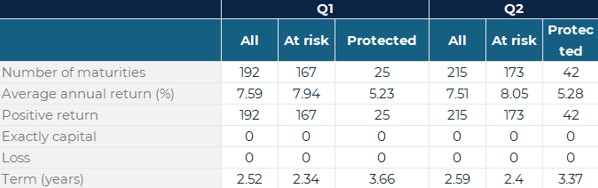
The number of products maturing during the first two quarters of the year increased from 192 in Q1 to 215 in Q2. Furthermore, the profile of products maturing also changed with capital-at-risk maturities increasing from 167 to 173. In comparison, capital protected maturities increased from 25 to 42 representing a much bigger relative jump.
Despite the increase in product maturities, the average annual return across all products fell slightly from 7.59% in Q1 to 7.51% in Q2. However, the figures for the two categories tell a slightly different story. The average return on capital-at-risk products increased from 7.94% to 8.05%, while the average for capital-protected products increased marginally from 5.23% to 5.28%. This overall reduction is caused by the greater proportion of protected products in Q2 but across the different risk profiles performance has been strong.
The average term of matured products increased slightly, for example for all products from 2.34 years in Q1 to 2.5 years in Q2. The average term for capital-at-risk products increased from 2.34 to 2.4 years, while capital-protected products decreased from 3.66 to 3.57 years. Overall, the maturity profile remained relatively consistent between the two quarters.
Another positive takeaway from the reports is the outcome data. In both quarters there were no products reporting losses or just returning capital, every product made a gain. Structured products can every single product perform well in different market scenarios over long periods. This is rarely true in the fund’s world, even in supportive markets.
Product Issuance
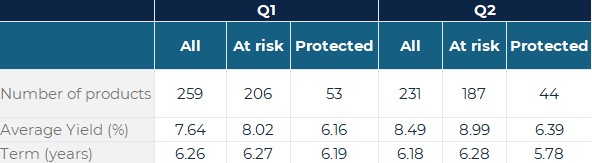
The issuance figures present a slightly different picture to maturities. The number of products issued in the past quarter declined from 259 in Q1 to 231 in Q2. Within these figures Capital-at-risk issuance fell from 206 to 187, while capital protected issuance decreased from 53 to 44. Issuance tends to be strong in the first quarter of every year as advisers seek to maximise allowances and investments before the end of the tax year on 5 April, therefore a little pullback in Q2 is to be expected.
Despite an issuance reduction, the average annual product yield increased substantially, from 7.64% in Q1 to 8.49% in Q2. The increase was particularly noticeable among capital-at-risk products, where the average yield rose from 8.02% to 8.99%. Capital-protected products also experienced a modest increase, from 6.16% to 6.39%.
Although Q2 saw slightly fewer products being issued, these products had higher average yields. This is consistent with a market in which providers were pricing products more attractively in response to prevailing market conditions. Interest rates drifted upwards which improves terms for all products, while volatility was also more raised in the second quarter which benefits yields for capital-at-risk products which have the bigger share of the market. This explains why the yield pickup for at-risk products was much bigger (0.97% against 0.23%).
Among individual product types, Defensive Autocalls remained the most dominant category, although issuance declined from 146 products in Q1 to 129 in Q2. Income Autocall products also declined from 36 to 26. Fixed Rate Callable products remained stable, while the Q2 report recorded a small number of Digital Growth and Fixed Income products.
Top Performers
The top performers for at-risk products for both quarters were stock-linked autocall products from Hilbert Investment Solutions. In Q1 and Q2, the highest annualised returns were 19.04% and 17.73%, respectively. These products represent a higher-risk, higher-reward approach, with returns dependent on the performance of the underlying stocks and whether the predefined autocall conditions are met.
Another notable product was an autocall from Mariana linked to a decrement index, which returned 12.83% in Q1 2026. Decrement indices typically deduct higher dividend yields than the conventional versions as a predefined amount is deducted from the reference level over time, regardless of the actual performance of the underlying. This generally leads to better product terms.
All these examples successfully called and therefore paid a strong return. There was a product in second Quarter from Meteor that was a worst of autocall linked to standard indices (FTSE-100 and EuroStoxx), which was the highest performing product linked to standard indices, and which returned 13.82%.
By comparison, capital protected products in the first half of the year offered more modest, annualised returns of between 6.29% - 7.00%, reflecting their additional capital protection feature. Regular providers in this group are Walker Crips and MB Structured Investments.
In conclusion, these reports from the first half of 2026 show a market experiencing higher maturity volumes but slightly lower quarterly issuance. The most notable positive development is the increase in average yields on newly issued products, with capital-at-risk-products reaching an average of 8.99% in Q2. At the same time, the increased number of capital protected maturities demonstrates continued demand for, and use of, products offering greater capital protection.
Although the number of new products issued slightly fell, the higher average yields suggest that Q2 remained an attractive period for investors seeking enhanced returns. The continued absence of reported losses among the quarterly maturities and the positive historical performance further reinforce the picture of a resilient structured products market during the first half of 2026.
Tags: Structured Edge