Greeks Index Comparison - FTSE 100 and Nikkei 225
This article is based on data provided by the SRP Greeks application, focusing on two of the indices covered by the service: the FTSE 100 Index and the Nikkei 225 Index. The FTSE 100 Index represents the 100 largest companies on the London Stock Exchange, while the Nikkei 225 Index is made up of the 225 top companies in Japan. Both indices are highly liquid and widely traded, making them popular underlyings for structured products.
Both indices serve as important underlying assets in their home countries and are used globally to represent their respective regions. Figure 1 illustrates how products linked to each index are distributed across the SRP Greeks markets. 84% of the products linked to the FTSE 100 Index originate from the UK market. This is consistent with its status as the most significant underlying in its home market. The index is not widely used in other regions and typically forms part of a European basket when included in products outside the UK. The Nikkei 225 is included in more products in the SRP Greeks universe (although it has a smaller overall notional) even though its home region is not included. The largest region with products linked to the Nikkei 225 Index is the US closely followed by Switzerland.
| Market | FTSE | N225 |
|---|---|---|
| UK | 83.50% | 1.56% |
| USA | 9.31% | 44.37% |
| Italy | 1.03% | 0.51% |
| Hong Kong | 0.00% | 0.15% |
| South Korea | 0.00% | 3.61% |
| France | 2.98% | 0.75% |
| Austria | 0.00% | 0.57% |
| Germany | 0.05% | 7.14% |
| Switzerland | 3.13% | 41.34% |
| Underlying | Percentage of Notional (Greeks Universe) | Total Notional USDm | Total Valuation | Number of Products | Delta | Relative Delta | Position Delta (USDm) | Vega |
|---|---|---|---|---|---|---|---|---|
| FTSE 100 | 1.55% | 3907.29 | 4225.61 | 1651 | 0.077369 | 0.165938 | 765.757 | -9.76571 |
| Nikkei 225 | 1.29% | 3255.22 | 3473.45 | 1977 | 0.013726 | 0.161645 | 679.549 | -1.58074 |
Position Delta
The Delta values represent the sensitivity of the portfolio to changes in the price of the underlying indices. The Position Delta for the FTSE 100 is 765.757 million USD, compared with 679.549 million USD for the Nikkei 225. This means that for a 1% change in the underlying value, the expected change in total valuation for products linked to each index is 7.65 million USD and 6.80 million USD, respectively. Consequently, the Greeks universe has a higher exposure to changes in the FTSE 100 than the Nikkei 225.
Position Gamma
Gamma measures the rate of change of Delta with respect to changes in the underlying price. The FTSE 100 has a Position Gamma of -53.1092, compared to the Nikkei 225 at -18.2111. The larger negative Gamma for the FTSE 100 indicates potentially higher trading risk, as Delta changes more rapidly with price fluctuations. Negative Gamma means that for negative price movements, Delta will increase, while for positive movements, Delta will decrease. This behaviour aligns with the characteristics expected of Gamma in capital-at-risk yield or target structured products, such as autocalls.
Vega
Vega measures the sensitivity of the portfolio's price to changes in volatility. The FTSE 100 has a Vega of -9.7651, while the Nikkei 225 has a significantly lower Vega of -1.5807. This indicates that the price of FTSE 100 linked products are more sensitive to shifts in market volatility. A negative Vega value signifies that as volatility increases, the value of the portfolio linked to the index is expected to decrease, which is crucial to consider in changing volatility environments.
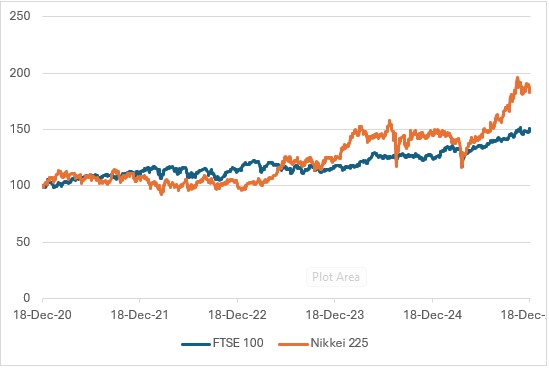
The FTSE 100 has a one-year historic volatility of 12.12%, which is notably lower than the Nikkei 225's one-year volatility of 23.42%. These levels are consistent with the longer-term average of realised volatility for both indices which is also illustrated by the 5 year index performance in Figure 3.
Although both the FTSE 100 Index and the Nikkei 225 Index are widely used underlyings in the structured products market, their roles within the SRP Greeks universe differ meaningfully. The FTSE 100 is predominantly a domestic underlying, with issuance concentrated in the UK, while the Nikkei 225 is more globally distributed, particularly across the US and Swiss markets.
From a risk perspective, FTSE-linked structured products exhibit higher Delta, Gamma, and Vega exposure, making them more sensitive to movements in the underlying level and volatility despite the FTSE’s lower absolute volatility. In contrast, the Nikkei 225, while inherently more volatile, shows lower aggregate Greeks exposure, reflecting differences in product construction and regional issuance patterns.
Overall, the analysis highlights how notional exposure, market structure, and product design can outweigh headline volatility when assessing risk in structured product portfolios. Understanding these dynamics is essential for issuers and investors seeking to manage exposure across regions and underlyings effectively.
Tags: ValuationsImage courtesy of: Denys Nevozhai / unsplash.com