
Enhancing structured product analysis
The US structured product market has seen very strong growth in recent years. This is primarily a result of compelling defined risk investment opportunities that have a strong rationale in volatile and uncertain markets as more investors appreciate the benefits they can bring.
An important further ingredient to the expansion and success of structured products has been the advancements provided by the major technology platforms of the industry. These have contributed in the areas of providing convenient market access, supporting education and compliance and helping firms with lifecycle and position management.
Principles of structured product analysis
As an investment class, structured products compete against other propositions that could be termed medium risk such as some insurance products, risk-controlled funds, ETFs and managed portfolios made up of stocks and bonds. These well-established alternative investment propositions generally have more favourable regulatory treatment, are simpler in nature and powered by well-established easy to use platforms from fund providers or large brokerages.
The StructrPro platform created as a joint venture between SRP and FVC has responded to recent market activity by making significant further developments in analysis capabilities and functionality. StructrPro is a unique proposition in the US market as it is a truly independent whole of market platform focusing on detailed analytics and firm-wide support at the market, portfolio and product level.
This article will consider the extended provision of market data and a future piece will examine deeper ways to dissect market trends.
Creating market indices
An important innovation provided by StructPro are the provision of structured product market indices. Using calculation techniques developed by FVC some years ago for the UK market, these indices show the performance of US structured product market on a continuous basis by considering the universe of products issued into the market as a pipeline of investments that define a very large portfolio.
Traditionally, structured product performance measurement has focussed on matured products only. There is nothing wrong with this approach and indeed it has many advantages. Waiting until products mature allows for simple calculation of payoff which can be undertaken by any party directly or by accessing the published value from an issuer or distributor. Structured products are fixed term investments therefore collecting performances and expressing these in tables or charts gives a clear indication of the success of a market.
Improving on simple maturity data
However there are a number of drawbacks with this rather simplistic approach. Maturity data will always lag the market given the typical lengths of products, and live products are always ignored in such analysis. Product maturities can also be very concentrated as they depend in large part of early maturities of Auto-calls and a strong period of market growth will result in a flurry of maturities.
The other main shortcoming is that only examining product maturities makes benchmarking against other assets (such as benchmark indices) difficult since structured products start and finish at different times in a typical continuous product issuance cycle, whereas indices and funds tend to be analysed on a simple point to point basis because of the time series data that is available. Benchmarking is important because investors will naturally want to know how the structured products market performs relative to other asset classes.
These issues are all addressed by the indices created for StructrPro. They are calculated via a precise algorithm with the same objectivity as mainstream and custom indices from traditional index providers. The algorithm would also be investable if the universe of products were sufficiently liquid.
Figure 1: US Structured product market performance and comparisons 2020-2023
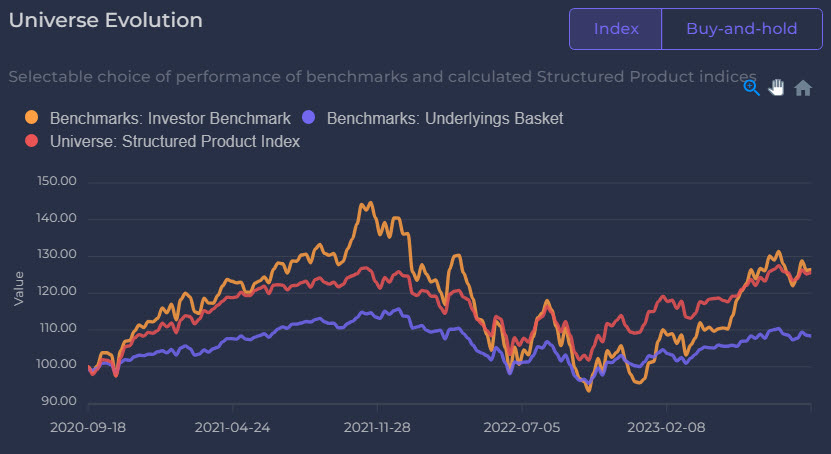
Figure 1 shows how the US structured product market has performed strongly over the last three years. The index is rebased to 100 three years ago (September 2020) and started by being composed of all live products open at that time proportional to the sales volume reported by www.structuredretailproducts.com. Income and product maturities are reinvested into the index when they occur to create a total return index. Products that start (have their strike date) after the start date are invested by buying an appropriate proportion and selling small amounts of existing positions to fund it. The result is the (red) Structured Product Universe curve which represents the most accurate evolution of the whole structured product market performance over time.
The first comparison that should be made is with the (yellow) Investor Benchmark curve depicting a simple portfolio of 40% S&P-500 total return ETF, 40% bond fund and 20% cash fund. The two curves are almost identical point-to-point but the benchmark curve exhibits much more volatility than the structured product index and has fallen significantly further during the time frame. Investors care about performance but also the journey and are made nervous by volatility and drawdown. This makes structured products much more attractive to most lower risk investors who are the natural target in the first place. The final (blue) curve on the chart is the result of an investment strategy comprised of committing money on the same schedule as the structured products issuance but directly into the underlyings themselves and not into the structured products. As can be seen the blue curve has consistently underperformed the red curve. This shows that the mix of structured products outperform the indices themselves and so the risk reduction and yield enhancement properties of the structured products are consistently adding value.
This more sophisticated but still intuitive analysis gives precise calculation of structured product performance versus simple benchmarks and the control group of the same underlyings. The concrete results make a powerful supporting case of the benefits of the US structured product market for issuers, distributors and advisors alike.
Tags: LifecycleA version of this article has also appeared on www.structuredretailproducts.com
Image courtesy of: Markus Spiske / unsplash.com