
Identifying trends with StructrPro
The following analysis has been extracted from StructrPro and covers products striking since July 2020. Products are grouped into six-month periods and the products within each period can then be group into categories of different criteria.
Recent issuance
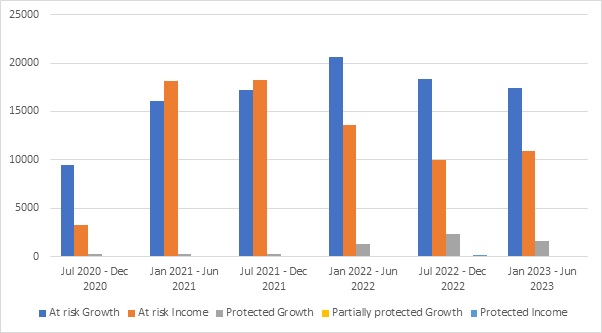
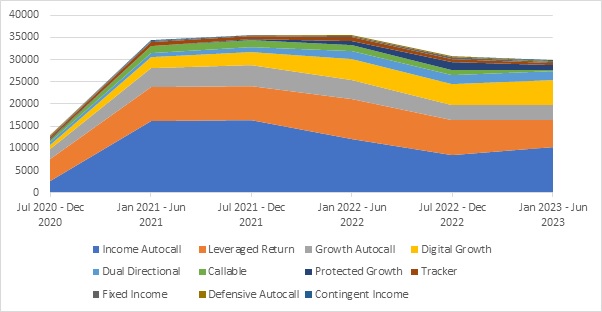
Figures 1 and 2 illustrate the change in product characteristics over the past three years. Figure 1 is broken down into broad categories focusing on return aims and capital repayment. Figure 2 covers a structured product specific product type breakdown. The charts also show the progression of total USD sales of products over the period. The most noticeable feature is the very low total for the first period of this analysis (shortly after the start of the Covid-19 pandemic) and the recovery over subsequent semi-annual periods.
From both charts we can see a change in the proportion of income vs growth products. During 2021 income autocalls were the most popular product type and at-risk income (which also includes traditional reverse convertibles) was the most common of the more general capital aim categories. This trend reversed for the following three periods as at-risk growth products have once again become the most popular category with leveraged return, and digital growth products increasing their market share. This suggests that where investors were looking to structured products to provide yield outside of traditional income investments there has been a shift back to growth products as risk free rates have risen and income seeking investors have other solutions elsewhere.
Rise of capital protected
Protected growth products have become more common over the past 18 months and there have also been a small number of capital protected income products over the past year. The rise in capital protection can also be contributed to the rise in interest rates. Higher rates makes structuring capital protected products easier as the capital protection costs less and therefore there is more to spend on options leading to more attractive product terms.
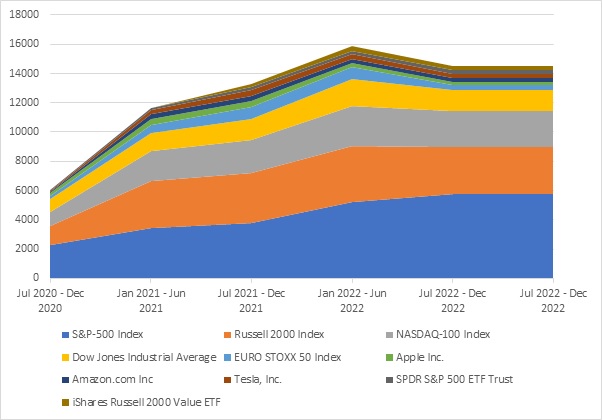
Figure 3 shows a breakdown for each period of the top 10 most common underlyings. This analysis shows how many times each underlying appears in a product either as a single underlying or as part of a basket. This chart shows the breakdown by number of product issued (rather than notional amount).
Most popular underlyings
The top five underlyings of the ones shown here are all benchmark stock market indices. These are consistently the most popular underlyings in the US and are used in products either as the sole underlying or as part of a basket. During 2021 when the market was recovering from Covid-19 there was a sharp increase in both the number of products issued and sales volume. During this period the spread of underlyings was greater than for subsequent periods and the proportion of products linked to the top five was lower than for the other four periods although still over 50%. Over the past year the number of products linked to the larger underlyings has been higher and more stable and the last period observed had the highest proportion of products linked to the S&P-500 suggesting some preference for products linked to established names.
Identifying trends in any market is interesting both in terms of looking backward and for forecasting future or expected behaviours. Keeping abreast of patterns such as some of the observations discussed here enables stakeholders to monitor the current situation and gives an idea of how the market reacts in certain environments which may help predict the direction the market is headed.
Tags: LifecycleImage courtesy of: Alex Rodríguez Santibáñez / unsplash.com