
Greeks Comparison - Microsoft and NVIDIA
This article is based on data provided by the SRP Greeks application and its focus is two of the stocks covered by the service; Microsoft and NVIDIA. They are two of the most popular stocks to which structured products are linked. NVIDIA is the more active and has a total of 30 USD billion notional invested in structured products in 2025 and has more than the S&P 500 index for the same period according to www. structuredretailproducts.com.
Microsoft and NVIDIA are technology firms that partner on different areas of their businesses. Microsoft relies on NVIDIA GPUs for AI and cloud services, while NVIDIA technology is also integrated into Xbox Cloud Gaming. These companies are closely interdependent across the areas of AI, cloud services, and gaming.
The one-year historic correlation between the two stocks is 69.1% which is relatively high even for two companies in the same sector. Figure 1 shows the correlation between six large US tech stocks showing that Microsoft and NVIDIA have the highest historic correlation.
| Microsoft | NVIDIA | Apple | Meta | Alphabet | Advanced Micro Devices | 1 Year Historic Volatility | |
|---|---|---|---|---|---|---|---|
| Microsoft | 100% | 69% | 21% | 63% | 41% | 65% | 22.11% |
| NVIDIA | 69% | 100% | 25% | 54% | 28% | 70% | 45.81% |
| Apple | 21% | 25% | 100% | 40% | 48% | 35% | 32.01% |
| Meta | 63% | 54% | 40% | 100% | 49% | 56% | 36.15% |
| Alphabet | 41% | 28% | 48% | 49% | 100% | 30% | 32.19% |
| Advanced Micro Devices | 65% | 70% | 35% | 56% | 30% | 100% | 56.63% |
There is 5.61 USD billion in live structured products linked to NVIDIA and 2.42 USD billion live linked to Microsoft in the product universe for the Greeks service. As popular underlyings many investors in structured products are exposed to these stocks although they still make up a relatively small proportion of overall outstanding notional compared to large indices such as the S&P 500 index.
| Underlying | Percentage of Notional (Greeks Universe) |
Total Notional USDm | Total Valuation | Number of Products | Delta | Relative Delta | Position Delta (USDm) | Vega |
|---|---|---|---|---|---|---|---|---|
| S&P 500 | 35% | 74917.2 | 88661.4 | 31091 | 3.0536 | 0.219165 | 23861.3 | -93.8155 |
| NVIDIA | 3% | 5605.05 | 5876.36 | 7486 | 3.06542 | 0.0225782 | 579.702 | -7.76928 |
| Microsoft | 1% | 2418.61 | 2514.25 | 4886 | 0.283437 | 0.0202067 | 48.7624 | -0.763823 |
| Underlying | Gamma | Position Gamma | Dividend Sensitivity | Theta | Vanna | Position Vanna | Charm | Position Charm |
|---|---|---|---|---|---|---|---|---|
| S&P 500 | -0.00143025 | -652.374 | -538.198 | 12.4312 | 0.005124 | 0.001813 | -24.243 | -24.243 |
| NVIDIA | -0.00221161 | -123.96 | -2.46957 | 0.860129 | 16.7494 | 0.003394 | -0.000138 | -0.000138 |
| Microsoft | -0.00322414 | -93.0423 | -2.49957 | 0.722535 | 7.00625 | 0.00158 | -0.311192 | -0.311192 |
Position Delta
The position delta for NVIDIA is 579.7 USDm compared with 148.762 USDm for Microsoft. This means that for a 1% change in the underlying value the expected change in the total valuation for products linked to each underlying is 5.79 USDm and 1.49USDm respectively. This means that the structured products market has a much higher exposure to NVIDIA stock price at the current time. The relative delta can be used to compare the expected change in value for changes in the underlying, showing that of the positions linked to each stock NVIDIA also has the higher unit exposure.
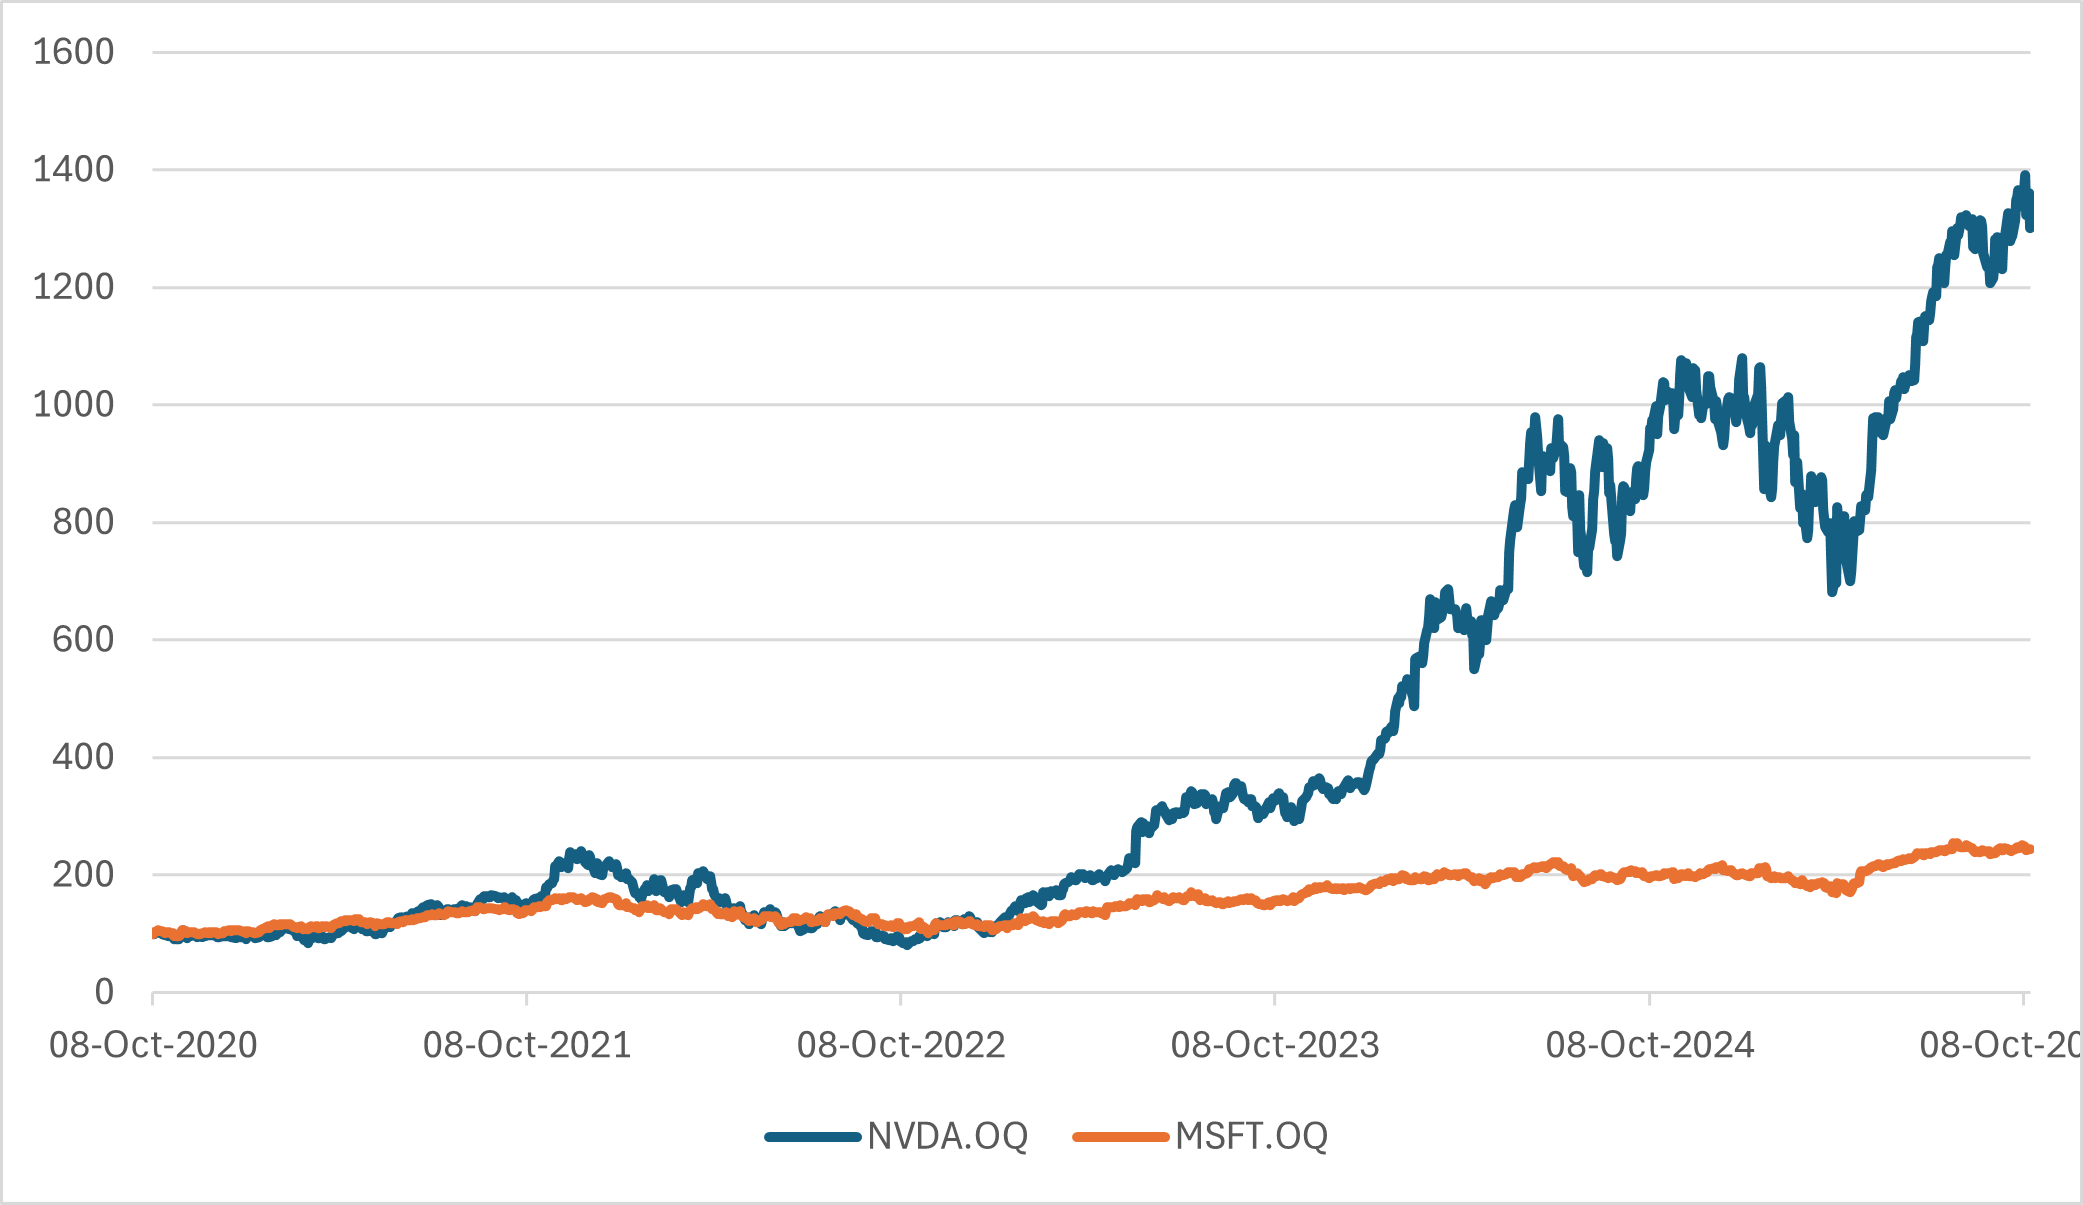
The chart in figure 3 shows performance of the two stocks over the past five years. Most products linked to these underlyings have a maturity of less than five years with the most common product term being between one and three years in both cases. For both stocks the most popular product types are the Autocall (income and snowball) and Reverse Convertible. More than 93% of NVIDIA and 96% Microsoft linked products are capital at risk. The chart shows that the stock performance of Microsoft has been quite steady over the past 5 years, this is also reflected in its one-year historic volatility of 22%. NVIDIA has been much more volatile and this can be seen in the chart.
The product with the largest position delta linked to NVIDIA is a dual directional product that struck in June 2024 and matures in June 2026. On the upside this product pays 100% of the growth of the underlying up to a cap of 170% of initial investment. As this is a growth product and, in the money, future underlying moves have a direct impact on expected product return.
Gamma
Gamma is the change in delta per unit change of underlying price. This gives an indication of the sensitivity of delta itself. The position Gamma suggests that NVIDIA’s delta is significantly more sensitive to market moves than Microsoft’s. This means that changes NVIDIA’s stock price will affect the sensitivity to future price moves.
The performance of these two underlyings is important to the structured products universe due to the outstanding notional invested in products linked to these underlyings. The Greeks data allows stakeholders to drill down further into the impact of changes in these underlyings on outstanding holdings and therefore the market as a whole.
Tags: ValuationsImage courtesy of: Hans Reniers / unsplash.com