
Greeks Comparison - Microsoft and NVIDIA (Part 2)
This article follows on from an earlier piece that examined Delta, Gamma and Vega sensitivities for Microsoft and NVIDIA using data from the SRP Greeks application. In this second part, we extend the analysis to the remaining sensitivities: Dividend Sensitivity, Theta, Vanna and Charm.
All figures are based on SRP Greeks data as at 18 November 2025, with comparisons made against the S&P 500 index to provide broader market context.
| Underlying | Percentage of Notional (Greeks Universe) |
Total Notional USDm | Total Valuation | Number of Products | Delta | Relative Delta | Position Delta (USDm) | Vega |
|---|---|---|---|---|---|---|---|---|
| S&P 500 | 34% | 85653.1 | 95952.9 | 34256 | 4.14956 | 0.237646 | 27459 | -126.85 |
| NVIDIA | 3% | 6618.27 | 6763.14 | 10207 | 5.40438 | 0.131314 | 980.138 | -9.48289 |
| Microsoft | 1% | 2655.81 | 2662.93 | 5735 | 0.50072 | 0.086738 | 247.251 | -1.35952 |
| Ratio of NVIDIA to Microsoft | 2.49 | 2.49 | 2.54 | 1.78 | 10.79 | 1.51 | 3.96 | 6.98 |
| Underlying | Gamma | Position Gamma | Dividend Sensitivity | Theta | Vanna | Position Vanna | Charm | Position Charm |
|---|---|---|---|---|---|---|---|---|
| S&P 500 | -0.0020095 | -879.93 | -582.421 | 24.9028 | 0.059961 | 396.778 | -0.003562 | -23.5715 |
| NVIDIA | -0.0850257 | -27.9662 | -10.333 | 4.04821 | 0.088655 | 16.0784 | -0.002883 | -0.52287 |
| Microsoft | -0.0019615 | -4.78267 | -3.22181 | 1.30651 | 0.009416 | 4.64929 | -0.000438 | -0.21612 |
| Ratio of NVIDIA to Microsoft | 43.35 | 5.85 | 3.21 | 3.10 | 9.42 | 3.46 | 6.58 | 2.42 |
Dividend sensitivity
Both Microsoft and NVIDIA have had relatively low dividend yields over the past five years. NVIDIA’s average yield is just 0.04%, while Microsoft’s is higher but still modest at 0.76%. Despite the low yields, the dividend sensitivity metric itself is derived by adding 100 bps to implied dividends across all maturities, so the low absolute dividend levels do not directly limit the calculated sensitivity.
However, the dividend sensitivity for both stocks is small relative to the S&P 500, and also small compared with what might be expected if sensitivity scaled in line with total product valuation or notional.
An increase in dividend will decrease the expected forward of equity underlyings and therefore most structured product prices will have an inverse relationship with dividend changes as they have a positive Delta to the underlying. Products that are in the money are less likely to be sensitive to dividends. This is especially true for target or binary structures like autocalls that do not participate in underlying growth. Products that are out of the money are more likely to be sensitive to an increase in divided as this will push growth expectations down and therefore increase chances and magnitude of capital loss where applicable.
Theta
Theta measures the sensitivity of total valuation to a one-business-day decrease in time to maturity. For NVIDIA, the three products generating the highest Theta are single-underlying autocalls with upcoming autocall dates within the next two weeks. Their current spot levels are between 101% and 104% of their initial reference, making them expected to call.
As these trades move closer to the next autocall date, the likelihood of early redemption increases (assuming all other market variables remain unchanged). This time-dependent increase in likelihood of return results in significant positive Theta.
Position Vanna
Vanna is a second-order options Greek that shows the sensitivity of an option’s Delta to changes in implied volatility. It captures the interaction between Delta and Vega and shows how shifts in volatility affect Delta.
NVIDIA’s position Vanna is 16.08, which is approximately 3.5 times Microsoft’s position Vanna of 4.65. This means the NVIDIA position Delta is much more sensitive to changes in implied volatility than Microsoft’s.
Part of this difference can be explained by the larger notional linked to NVIDIA, which is approximately 2.5 times that of Microsoft within the SRP Greeks universe. However, the notional gap alone does not account for the full difference in position Vanna.
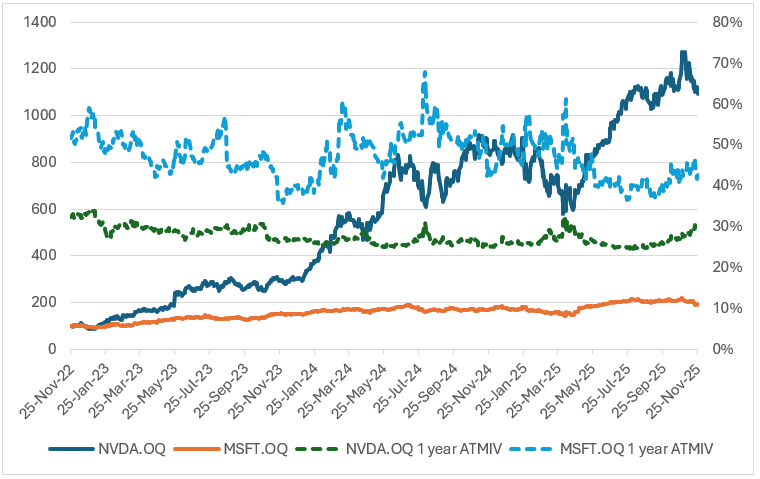
The three-year performance and one-year ATM implied volatility chart helps explain why NVIDIA has a higher position Vanna than Microsoft.
NVIDIA’s price performance over the past three years has been significantly stronger and more volatile, with upward trends accompanied by larger swings in daily and weekly returns. This behaviour is reflected in the higher implied volatility also shown in the chart, which has generally remained above Microsoft’s throughout the period.
Products linked to NVIDIA have a higher Vega and higher volatility than products linked to Microsoft as shown in Figure 1. Combining this with a positive Delta and the larger outstanding notional leads to a higher position Vanna for NVIDIA.
Position Charm
The position Charm of NVIDIA is almost 2.5 times the magnitude of the position Charm of Microsoft. This suggests that the difference between them can likely be explained by the difference in the size of the holdings rather than differences in the trades themselves. Charm is the sensitivity of the Delta to a change in the maturity (one business day decrease) so as for Theta we would expect trades nearing maturity or likely call date to have the largest Charm.
The performance and volatility characteristics of Microsoft and NVIDIA make them significant within the structured products universe given the large outstanding notionals linked to both underlyings. Detailed Greeks analysis (particularly Theta, Vanna and Charm) provides deeper insight into how changes in time and volatility flow through to valuations at the portfolio level.
Tags: ValuationsImage courtesy of: Hert Niks / unsplash.com