
Worst USA performers
I previously wrote about the high performing popular underlying assets in the US equity structured products market. The focus of this article will be structured product underlyings at the other end of the performance table, concentrating on those that have had the lowest performance over the past year.
Underlying performance (index, stock or other asset class) is a key driver of product returns. Structured products are often positioned as a lower risk way of gaining exposure to underlyings. By looking more closely at product performance for those underlyings that have not performed well over a period it will be interesting to see if the structured products provide protection to investors compared to direct investment in the underlyings.
Underlying returns drive poor performance
The performance statistics shown here were taken from the US structured product analysis service Structrpro.com. Structrpro can be used to analyse live and matured products from the SRP database using analytics powered by FVC. For this study we have restricted results to underlyings linked to at least 100 structured products on the service.
| Underlying asset | performance - 6 months | performance - 12 months | performance - 24 months | Product count | Single asset products | Live products performance return p.a. | Matured products performance return p.a. |
| Snap Inc | -0.3184 | -0.8137 | -0.8186 | 109 | 0.86 | -54.76 | -42.65 |
| ARK Innovation ETF | -0.2166 | -0.6769 | -0.7542 | 515 | 0.71 | -47.85 | -34.83 |
| Tesla, Inc. | -0.4512 | -0.6547 | -0.4681 | 1264 | 0.81 | -37.88 | 15.55 |
| Meta Platforms Inc. | -0.2537 | -0.6505 | -0.5574 | 488 | 0.55 | -45.23 | 5.24 |
| Docusign Inc | -0.0342 | -0.6428 | -0.7547 | 183 | 0.86 | -59.53 | -27.22 |
Table 1: Worst performing structured product underlyings over 12 months (Structrpro.com) up to 30 Dec 2022. Qualifying assets are linked to at least 100 structured products on Structrpro.com. The table also shows the average annualised performance of both live and matured structured products linked to each underlying.
Tech stocks suffering
It can be seen from the table that four of the five worst performing underlyings of 2022 are individual stocks and the other is ARK Innovation ETF. The stocks are technology companies with the exception of Tesla although particularly since the Twitter takeover it clearly has similar exposures.
For all five underlyings their highest level for 2022 was right at the start of the year (3 January 2022). The stock with the worst performance over the period was Snap Inc. It was down 81% from its level at the beginning of the year. The one year historic volatility of the underlying is currently 122%.
Capital at risk products fall fastest
Most at risk structured products come with a capital protection barrier allowing for capital return at maturity in the case of falls in the underlying up to a certain level. The average barrier level for products linked to Snap Inc on structrpro.com is 55%. Stock price falls of the magnitude seen by all of these underlyings over the past twelve months are rarely going to be caught by the protection offered by such barriers. However, these performance figures are point to point so given products strike and mature on a rolling basis barriers may well still preserve capital in some cases depending on the strike and final level of the asset.
The historic volatility for these five assets is very high which is unsurprising given their recent performance. In all cases the one year historic volatility is higher than at this point last year. The one year historic volatility of the benchmark has increased by more than 85% itself.
Table 2: One year historic volatility for stocks as at 01 Jan 2022 and 01 Jan 2023
| Date | Snap Inc | ARK Innovation ETF | Tesla, Inc. | Meta Platforms Inc. | Docusign Inc | S&P 500 index |
| 44562 | 0.6502 | 0.3966 | 0.5412 | 0.295 | 0.7307 | 0.1301 |
| 44927 | 1.2219 | 0.6734 | 0.6566 | 0.6709 | 0.8124 | 0.2413 |
| Increase | 0.8793 | 0.6979 | 0.2132 | 1.2742 | 0.1118 | 0.8547 |
Focus on Tesla
Of the five underlyings Tesla Inc is ranked third worst by 12 month performance however it has the highest returns of this group when looking at structured product returns, both live and matured. The matured products are showing a gain of 15.55% whist the live products are showing a loss of 37.88%. Figure 1 plots value (both maturity and live) vs time in years for products linked to Tesla. This shows that even over the past year where the stock itself saw huge falls there were structured products returning positive returns. This can be explained by the high proportion (96%) of income autocall products which can pay maximum returns as long as the capital protection and income barriers are not breached.
Fig 1: Payoff Scatter for products linked to Tesla Inc
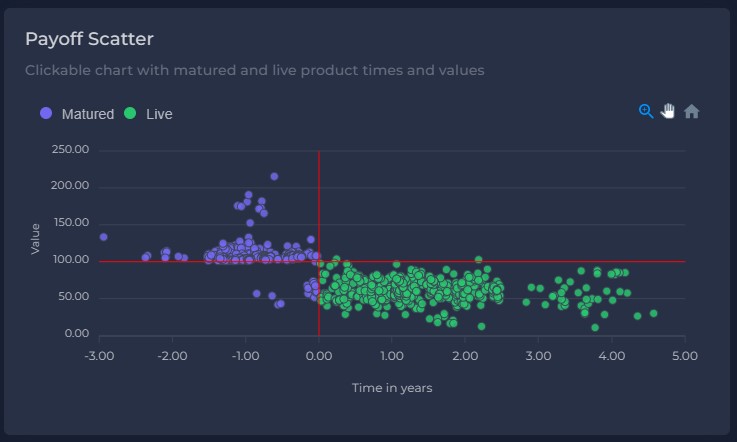
The outlook for the live products is not so promising, but this is to be expected given that most of them struck at levels prior to 2022 or before all the market decline. The average barrier level for Tesla products at strike was set at 52.72%., however The average barrier level for live products given current stock levels is now 156.58% meaning significant stock rises are required for these products to repay capital and avoid barrier breaches. For those products where the coupon is contingent on a certain level as well as capital repayment the equivalent average coupon barrier level is currently 164%. Given that these products have maturities of up to five years there is still ample time for the stock to recover for many of the products.
Overall the performance of the structured products both matured and still live linked to these underlyings is greater than the performance of the underlying itself over the time period. Structured products usually have some feature or mechanism used to reduce risk compared with the asset they are linked to. However, these can only go so far to protect investors given that to offer high yields the products cannot have full capital protection. In cases of an extreme market downturn investors will inevitably suffer some significant losses.
Tags: LifecycleA version of this article has also appeared on www.structuredretailproducts.com
Image courtesy of: Acton Crawford / unsplash.com