
Top USA performers
This article will look at the high performers drawn from popular underlying assets in the US equity structured products market. Whilst product payoff is important, for all structured products the performance of the underlying stock or index is a key driver of product returns.
The choice of underlying when structuring a product depends on a number of factors. Benchmark indices and ETFs are popular as a way to gain exposure to the broad market or sector they represent. These are always popular with investors looking to use structured products within their equity-linked portfolio.
Alongside major indices, the top stocks in the S&P 500 continue to be popular and are regularly chosen as structured product underlyings. Investors are comfortable with these names and seek exposure through these stocks as a key part of a US equity holding.
Where are the top performers?
Some companies or ETFs are more cyclical in nature and therefore come in and out of favour. Certain stocks can represent a trend or a theme or be particularly attractive due to other economic factors. In addition to fundamentals some underlyings may be chosen for their pricing properties and therefore their ability to generate attractive returns for a given payoff structure. High volatility stocks are a good example of this.
The performance statistics shown here were taken from the US structured product analysis service Structrpro.com. Structrpro can be used to analyse live and matured products from the SRP database using analytics powered by FVC. For this study we have restricted results to underlyings linked to at least 100 structured products on the service.
The five highest performing underlyings on Structrpro over the past year include three oil and gas companies and two energy sector ETF. This is reflective of the huge gains seen globally in the energy sector.
Table 1: Top performing structured product underlyings over past 12 months (Structrpro.com). The table also shows the average annualised performance of both live and matured structured products linked to each underlying.
| Underlying asset | performance - 6 months | performance - 12 months | performance - 24 months | Historic volatility (1 year) | Product count | Live products performance return p.a. | Matured products performance return p.a. |
| Exxon Mobil Corporation | 0.3129 | 0.7719 | 2.1236 | 0.3536 | 132 | 0.3219 | 0.1554 |
| Chevron Corporation | 0.1428 | 0.6333 | 1.2612 | 0.3267 | 104 | 0.1818 | 0.2187 |
| Energy Select Sector SPDR Fund | 0.1974 | 0.6143 | 1.757 | 0.3539 | 511 | 0.144 | 0.1394 |
| SPDR S&P Oil & Gas Exploration & Production ETF | 0.2387 | 0.4782 | 2.2962 | 0.456 | 439 | 0.0864 | 0.1165 |
Energy sector dominates
Exxon Mobil Corporation has had the highest growth of any qualifying underlying over the past 12 months of 77.19%. Its performance over the past 2 years to date is an extremely strong 212.3%. The structured product performance statistics also show high returns for both live and matured products linked to this underlying of 32.19% and 15.54% respectively. While these product returns are good they are significantly lower than the performance of the asset itself.
The vast majority (93.18%) of products linked to Exxon Mobil Corporation are income autocall structures which pay a defined return over the product life. When the underlying performance is good, the products will call and mature early, paying the fixed return. Therefore if underlying performs exceptionally well the product will not match the returns that could have been achieved through direct investment in the underlying and will be limited to the levels defined in the product terms. This is the nature of most structured products where some potential return is exchanged for a reduction in risk and in the case of autocalls a greater chance of a fixed moderate return.
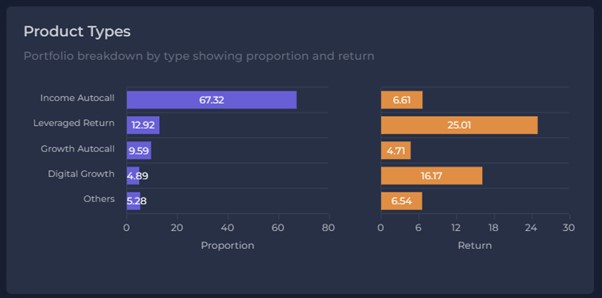
The most commonly used underlying of the top five performers is the Energy Select Sector SPDR Fund. Fig 1 shows a breakdown of products linked to this underlying. This shows that the income autocall product is again the most popular type although the leveraged return is by far the best performing in terms of returns. This is to be expected since in a bull or growth scenario investors will gain from payoffs that have higher exposure to the underlying rather than defined return or income products.
Fig 1: Returns and breakdown by product type for US structured products linked to Energy Select Sector SPDR Fund (Structrpro.com)
Translation of underlying to product
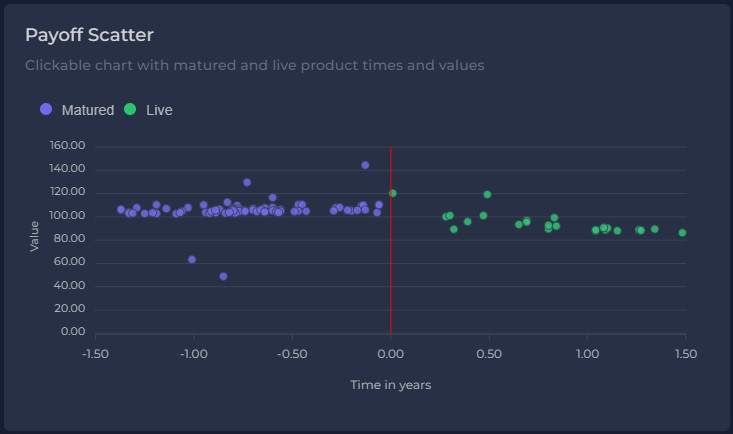
The payoff scatter chart in Fig 1 shows the expected value of matured and upcoming product maturities. The matured products have paid par plus an income stream in most cases, these are shown on the chart in purple. The live products have a lower expected return than those that have matured due to recent falls in the underlying stock price. The average level required for the relevant products to call is 120% of the current stock price meaning a significant rise is needed for the products to mature early.
Due to the high volatility of the asset the average barrier level for these products was quite generous compared with US products in general. Across all products linked to this underlying, barrier was set at 57% of the initial level on average. It is now currently at 68% of the current stock value. This means that for most products the stock is still above the barrier level has moved closer to it. Provided there are no further large falls in this underlying, the majority of these products will return their capital investment and pay the remaining income stream. Given the losses in the underlying over the past six months that would no doubt feel like a good outcome for investors.
Fig 2: Payoff Scatter for products linked to Petróleo Brasileiro S.A. – Petrobras (Petróleo Brasileiro S.A. – Petrobras)
The relationship between underlying performance and structured product performance can be complex especially when viewed in aggregate.
Underlying performance is easily measured point to point but structured product performance depends on dates, maturity and product characteristics. The defined and risk reducing nature of structured products means that in most cases they will not match outstanding underlying returns but they have plenty of compensating features.
Tags: LifecycleImage courtesy of: Trey Musk / unsplash.com