
Investing in Twitter
The US social media giant Twitter Inc is a high profile, volatile and at times rewarding stock which has significant interest and activity in the structured product market and the wider investment world.
As at 29 June 2022 there are 496 live products on structuredretailproducts.com with exposure to Twitter Inc.. The regions where Twitter is most frequently used as an underlying are Switzerland, Taiwan and the US with 155, 140 and 112 live products respectively. Of the total number of products on the database, 77% are multi asset and over 65% have an auto-call feature. Approximately 75% of products have a maturity of between one and three years.
Performance and volatility
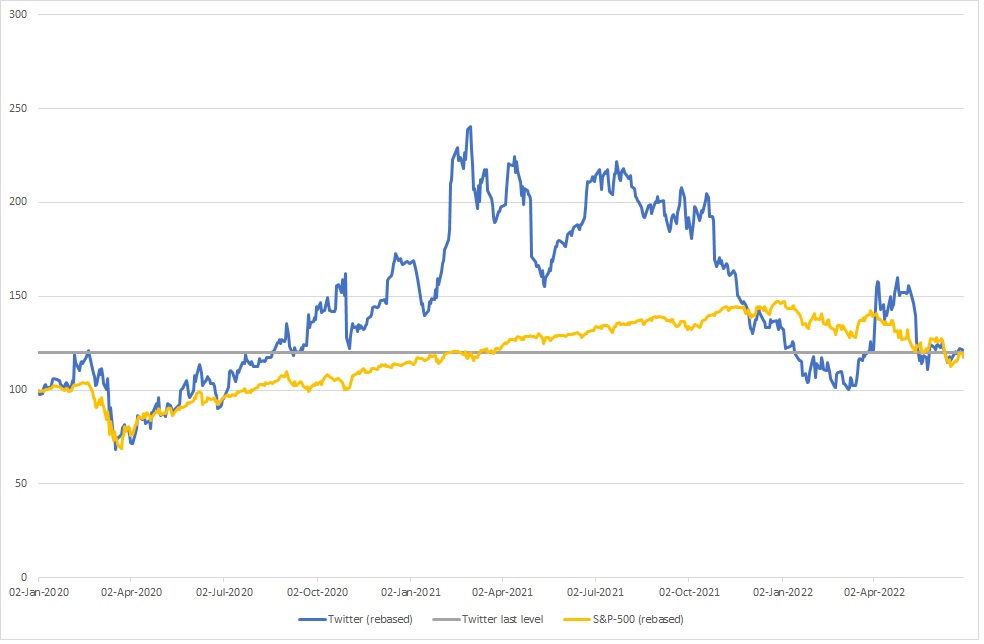
Figure 1 shows the rebased stock performance for Twitter from 2nd January 2020 to date. During 2020 there was generally an upward trend for the share price. This was followed by a period of broadly sideways movement. However, since August 2021 the stock price had been steadily falling until the news in April of this year that Tesla’s owner Elon Musk had become the largest shareholder. This caused a sharp rise in the stock price as speculation mounted over a takeover bid. The stock level remained high until falling back by the end of May, roughly in line with the wider US market. Comparing the stock performance to the S&P 500 index over the same period demonstrates where this stock has deviated from the general market trend over the period and also how much more volatile the stock is than the benchmark index.
The one year historic volatility for Twitter is approximately 50% compared to 20% for the S&P-500.. The high volatility of the stock makes it an attractive underlying for structured products since the volatility level and associated premium can be used to generate high headline rates whilst linking to a well known name that investors recognise.
Figure 1: Twitter (blue) and S&P-500 (yellow) rebased 02 Jan 2020-28 Jun 2022
Analysis from StructrPro
The US structured product data service Structrpro.com can be used to analyze both live and matured products from the SRP database using analytics powered by FVC. Figure 2 shows a summary of the data available for Twitter linked products alongside the whole Structpro.com universe. The performance summary table gives a breakdown of product outcomes broken down into live and matured products.
The first observation is the large difference in performance between live and matured products linked to Twitter. Of the matured products the vast majority (87.5%) of products have recorded a gain whereas for live products 91.7% are currently showing a loss. The total universe of US products is showing similar results in that the proportion of products with gains is much higher for the matured set than for the live products. However, there are significantly less live products showing losses than for Twitter and the annualized return figure at -1.74% is much smaller in magnitude than for live Twitter products which currently have a return per annum of -16.99%.
Twitter’s stock price has fallen by over 43% from a year ago and the closing level at the time of writing is lower than on any day during 2021. Therefore most products issued during this period are currently pricing significantly below par. This effect is less marked for other products such as those linked to indices because the underlyings have not dropped as much and the products often have more protection.
Most of the products linked to Twitter are income autocall and have some sort of protection barrier therefore there is a chance of recovery if the relevant levels are met and the barriers are not breached.
Fig 2: Performance summary for Twitter and the whole Structrpro.com universe.
| Universe | ||||
| Live | Matured | Live | Matured | |
| Gain | 8.33% | 87.5% | 32.55% | 96.54% |
| Capital | 0% | 0% | 0% | 0.28% |
| Loss | 91.67% | 12.5% | 67.45% | 3.46% |
| Return p.a. | -16.99% | 16.4% | -1.74% | 10.77% |
Figure 3 is taken from a Structrpro portfolio analysis report for Twitter linked products and shows four key product features. For example the average initial barrier level is 62.4% whereas the current barrier level, as a percentage of the current stock level, is 112%. This indicates that there are a lot of products for which the current level of the stock is below the barrier level and therefore without some recovery in stock level investors in these products will lose capital. This situation has been caused by the dramatic decline in the Twitter share price. The same effect can be seen across the other key levels.
Fig 3. Average current and initial levels for key product features
| FEATURE | INITIAL (%) | CURRENT (%) | NUMBER |
| Strike | 100 | 179.35 | 60 |
| Barrier | 62.4 | 112.26 | 58 |
| Autocall | 100 | 185.35 | 47 |
| Coupon | 62.48 | 113.98 | 55 |
This current snapshot of structured products linked to Twitter reflects the challenging recent trajectory of the company’s stock. However, as we have seen over the past 18 months and in the returns demonstrated by matured products, this is a volatile stock which has the potential to demonstrate big gains as well as losses. Therefore there is still time for products to at least return full capital and outperform a direct holding in Twitter stock which would have been an investor’s other considered course of action.
Tags: ValuationsA version of this article has also appeared on www.structuredretailproducts.com
Image courtesy of: Jeremy Bezanger / unsplash.com