
UK Structured Product Market Study
The UK structured product market has had a strong start to 2022 continuing the pattern of increased issuance and sales volumes that has been witnessed in the past two years. The numbers suggest that the market is on track to exceed the previous highs of 2017 and 2018. These were reached before the twin effects of PRIIPs and COVID impacted product issuance. In the case of PRIIPs it was the accompanying regulatory burden and then COVID interrupted normal market operations and bank ability and appetite for new business.
Structured Retail Products (SRP) and FVC are collaborating in bringing a new structured product lifecycle and portfolio management application named StructrPro to the US market which will be fully launched by the end of April 2022. This service will allow users to track and analyse products from the universe of over 45,000 open or recent products in the US market covered by SRP. Combining SRP’s US product database and FVC analytics will give market participants such as banks, distributors and advisors powerful tools to gain insight into the structured products in the market and in individual portfolios.
Support for advisers
In the UK, FVC has provided analysis and comparison metrics on retail structured products for over twenty years through its advisor service StructuredEdge. This service contains an initial pre-sales analysis available during the product offer period for advisors. By combining the StructuredEdge database of products with new performance measurement functionality that FVC has now developed it is possible to take a closer look at the UK structured product market providing breakdowns and performance statistics.
This article will focus on UK retail structured products that have appeared on structurededge.co.uk with a strike date on or after 1 July 2017, representing nearly five years of new products. Since the majority of UK products have a maturity of between five and ten years this means that most product maturities in this universe are due to early maturity (auto-calling) rather than reaching their final maturity date. Part of the focus of the approach is to combine matured and live products to give an overall picture of market performance.
Success of UK structured products
Table 1 below shows the distribution of returns of matured products. The most frequent annual return is the bucket of between 7.5% and 10% per annum and in total over 92% of the universe have returns of at least 7.5% per annum. This is made up of products which have called paying income over their life-time or the final “snowball” return amount.
Table 1: Frequency of return per annum for matured products in UK (products striking on or after July 2017)
Bucket p.a. % | Frequency % |
<-10 | 0 |
<-7.5 | 0 |
<-5 | 0 |
<-2.5 | 0 |
<0 | 0 |
<2.5 | 2.08 |
<5 | 5.51 |
<7.5 | 56.25 |
<10 | 27.08 |
<12.5 | 7.14 |
<15 | 1.04 |
<17.5 | 0.15 |
<20 | 0.45 |
>=20 | 0.3 |
Table 2 below shows product returns for all products analysed consisting of both live and matured products. For live products the return is calculated using the latest independent valuation calculated by FVC for the product including previously observed cash flows.
Market choices
As can been seen below, the most common product types are different variations of autocalls. The income autocall has the highest annualised return at 9.23%, but makes up the smallest proportion of autocall products by type. This is due to the defensive nature of income autocalls which pay income prior to final maturity.
The digital growth is the largest product type after all the autocalls but has a much lower per annum return. This is because digital growth products are often capital protected and therefore offer more modest returns because of the lower risk.
Table 2: Return per annum by product type for live and matured products in UK (products striking on or after July 2017)
Product Type | Proportion % | Return p.a. % |
Defensive Autocall | 43.67 | 5.57 |
Growth Autocall | 30.72 | 5.66 |
Income Autocall | 12.9 | 9.23 |
Digital Growth | 6.3 | 2.15 |
Others | 6.4 | 4.77 |
Tracking portfolios
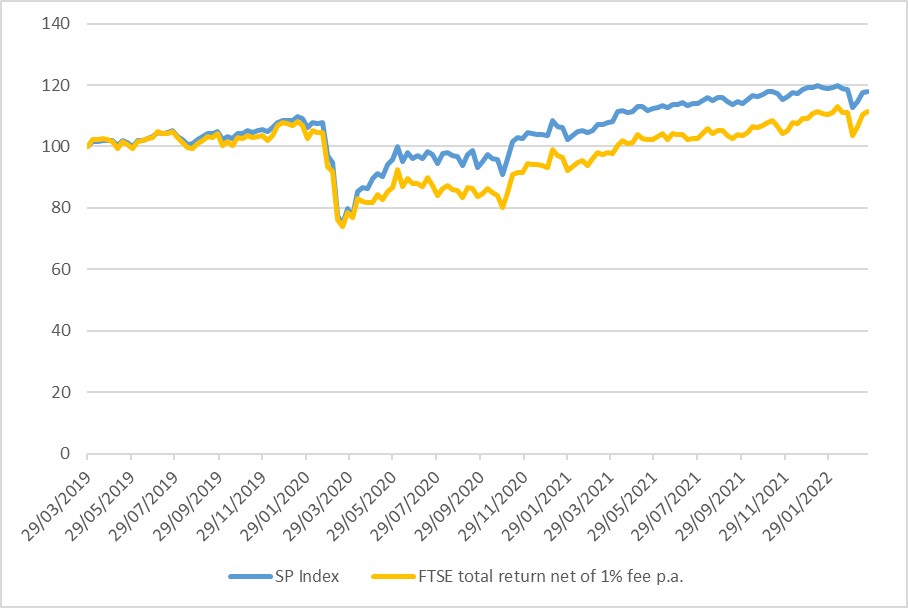
As part of the detailed lifecycle analysis that is contained within this application, it has been possible to create an index of structured product returns using the UK retail product database as the universe and weekly product valuations for all products to create and define an index. The index methodology consists of a process to invest as equally as possible across all products in the market, buying an equal amount of each new product and using realized cashflows to re-invest back into the index. It therefore closely mimics an investor or fund being equally invested in products (or a representative subset) in the UK market over time. The graph shows the performance of the structured product index against the FTSE-100 Total Return index (with 1% p.a. fees deducted) to represent a typical equity tracker fund after fees.
The index closely tracks the FTSE-100 Total Return Index from its inception in March 2019 until after the major market fall in March 2020 where the structured product index recovered quicker than the FTSE-100. This was because of a combination of product protection features and lower volatility levels helping product valuations once markets had calmed down somewhat. The structured products index and the FTSE-100 are very closely linked because so many structured products in the UK are linked to the FTSE-100 or other UK equity indices.
Chart 1: Structured products index vs FTSE TR index (minus 1% p.a. fee)
Due to the varied nature of structured products and their fixed term construction it has always been challenging to track market and product performance than for other investment types. This contrasts with the fact that fund performance statistics by sector or fund manager are easy to compile and are taken for granted to track trends or benchmark returns.
Therefore, the innovative methodology used in this application should prove very useful for measuring the structured product market.
The provision of more detailed individual and aggregate product level analysis of structured products in a given market is a powerful tool for advisors and other professionals and gives more insight into the structured product sector.
Tags: Structured EdgeA version of this article has also appeared on www.structuredretailproducts.com
Image courtesy of: Nick Fewings / unsplash.com