
US products under the microscope
Virtually all investment markets have been on a rollercoaster ride in 2020. All investors need to keep a close eye on their portfolio, making sure that they are happy with the performance and risk profile of all their investments. If not, many investors or the advisers that act for them should consider rebalancing their portfolio as market conditions change.
Not surprisingly, equity markets have been in for a turbulent time, and since most structured products are linked to equities, this has had a corresponding effect. Many structured products are bought as buy and hold investments, and most of the properties of a structured product such as capital protection apply when they are held to maturity. However, structured products also have daily secondary market prices to put them on a par with stocks, bonds, funds and ETFs. During 2020 understanding how and why these values change is more important than ever.
Sample US structured product set
The US has one of the most varied and important structured products markets in the world, and many of the products issued are linked to the S&P-500 Index. In this study we will analyse the performance of five typical products during this year.
The product terms were all sourced from www.structuredretailproducts.com, and the independent fair values for this analysis are calculated by FVC’s Nextval valuation platform at www.futurevc.co.uk/nextval.
| Product | Issuer | Product type | Strike Date | CUSIP |
| 1 | JP Morgan | Digital | 02-Jul-19 | 48132CWX7 |
| 2 | CIBC | Leveraged Return | 07-Oct-19 | 13605WSW2 |
| 3 | Bank of Nova Scotia | Autocall | 10-Oct-19 | 06417Q767 |
| 4 | Morgan Stanley | Absolute return | 26-Sep-19 | 61765QR43 |
| 5 | Goldman Sachs | Bear Sharkfin | 05-Jul-19 | 40056FTJ4 |
All of the products had strike dates in 2019 and they were all in force during 2020 with final maturity dates in 2021 or later. One of the five products has just auto-called (23 October 2020), but as of this date the remaining four products are still live.
The five products divide into three capital at risk and two capital protected.
The capital at risk products consist of a digital payoff from JP Morgan with a defensive digital level of 90% to pay 8.3%, a leveraged return note from CIBC with three times upside to a cap and a six year auto-call from Scotiabank (which has now called).
The two capital protected products are an absolute return note from Morgan Stanley with knockout barriers at 80% and 120% of the initial level and a bear Sharkfin product from Goldman Sachs which stands to benefit from market falls of up to 29.5%, but returns capital only if the market falls below this level or finishes above its starting point.
S&P-500 index and structured product valuations
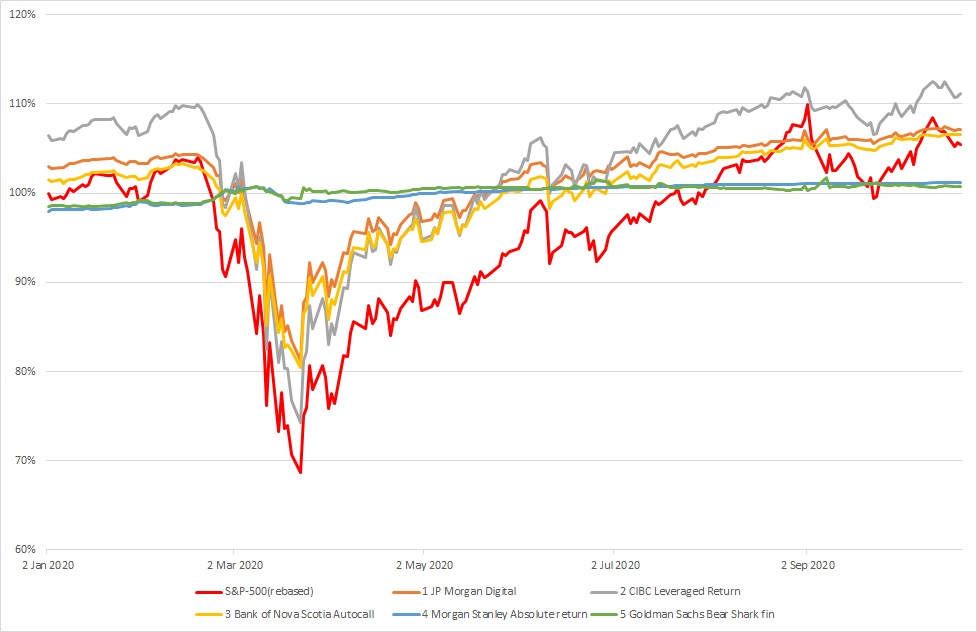
Source for valuations: FVC Nextval service. In this chart the S&P-500 has been rebased to 100% at the start of the year, whereas the five structured products show their estimated secondary market valuations at that point.
During 2020 the S&P-500 initially posted large losses, falling by 31.3% from the start of the year to the lowest point on 23rd March at the height of the early phase of the pandemic. It recovered reasonably quickly and now stands up 5% year to date (as at 23rd October). The historic volatility of the index has been 38.2% this year, an extremely high figure for such an extended period. By contrast the historical volatility for 2019 was a much more typical 12.6%.
Capital at risk: understanding secondary market values
The three capital at risk products exhibited the highest volatility and movement, which is to be expected, and they all followed the index down in March to a certain degree. In general, leveraged return products show the highest volatility of common structured product payoffs because of their similarity to the index profile itself. Typically, the geared but capped upside combined with partially protected downside without dividends paid means its behaviour can fairly closely track the index during the product lifetime in many scenarios. This is consistent with these calculations since the leveraged return product price series has a volatility of 34.4% and a maximum fall of 30.2%, both similar to the equivalent index statistics.
A little lower down the risk spectrum are the digital and the auto-call. Both have more protection features, the digital can afford the index to fall by 10% and still pay its return, and the auto-call has multiple chances to call over its lifetime. These products showed volatility levels around 24%, significantly less than the index volatility as the various defensive features protect the products against some of the market falls.
As we have already noted, structured product performance is really about maturity payoffs rather than in-life behaviour. The auto-call has now successfully called returning 6.5% in one year, and the digital product stands with the index at 115% of its starting level, just needing to remain above 90% at the product’s maturity a little over two months away. This payoff of around 5.5% annualized return will still be made even if the market falls down towards that key level in the last two months of its lifetime.
For capital at risk products in volatile conditions, secondary market losses can come close to matching the underlying index in the short term because they suffer from the “delta” effect of the index falling plus also the “vega” contribution of increased volatility which is typically seen in such circumstances and certainly manifested itself this year. Some bear markets (2008 being the obvious example) are also accompanied by increased banking credit spreads, which would further hurt the secondary market value, but this effect was largely absent this time.
In many cases, the defensive properties of structured products will help avoid capital losses for any product with typical protection features, unless the market shows sustained losses over the full product horizon perhaps of two years or more. Even if this turns out to be the case, the fall in secondary market prices can be unnerving for investors.
Capital protected: going market neutral or bear
Finally, the two capital protected products make for interesting analysis. Both are relatively short (Morgan Stanley at 2.5 years and Goldman Sachs at 2 years) and are 100% capital protected with no market risk. Given that both Interest rates and credit spreads are at very low levels, it is well known that there is extremely little premium that can be employed to buy options to provide the growth element over such a horizon. Typically, such products would not try to capture simple upside (a capped call for example), since the product terms would look unattractive with very low participation rate or maximum return.
Other solutions are generally preferred, these include the barrier absolute return payoff of Morgan Stanley which will knock out if the index rises or falls by 20% at any time during the life of the product and in such circumstances will pay a minimum return of 2%. If the barriers are not hit, then the absolute level of the index move (which could be up to 20%) is earned. The Goldman Sachs note is similar but plays only on the downside. If the index falls by over 29.5%, then the product immediately terminates, paying capital back to the investor. If this does not occur and the index remains below its start level at maturity, then the amount of index loss is paid as a positive return.
The Morgan Stanley product is effectively market neutral and the Goldman Sachs one a bear play. However, the one touch nature of the barrier means that the Morgan Stanley product can lose the chance to generate a return at any time. In fact, it hit its downside barrier on 20th March, and so after only six months of a 2.5 year term only the minimum return can now be earned. Interestingly, the product spent only two days below the 80% level (March 20th and 23rd) because the market rallied immediately after that point. The product has also spent exactly one day so far above the 120% level (September 2nd - the high of the year to date). This event is irrelevant because of the earlier hitting of the barrier on the downside, but an event which only happened three times in a year and needed to happen just once has prevented the product paying off. This underlines the fact that it is actually quite hard to stay in a 40% corridor every day for over two years.
It is a similar story for the Goldman Sachs bear product. It has not actually breached the barrier so far, getting down to 75% of the starting level before rising again and not breaching 70%. The index has risen fairly steadily since then all the way back up to the product’s starting level (an S&P-500 level of 2990 points) and reaching 115% at the time of writing. Despite the fact that the index moved all the way through the target area for product return (index falls of up to 30%), the secondary market value did not exceed 102%. This is extremely counter intuitive, but it must be remembered that the option was purchased with very little premium and those same characteristics of limited chances of success remain.
Conclusion: all products did their job well
In summary, we see that it is important to understand the trajectory of a structured product’s secondary value to understand its position in a portfolio, but sometimes this path can seem at odds with likely maturity proceeds.
The capital at risk products suffered some downside, but two of the three at least appear set for positive returns. The capital protected products, structured as they are, appear likely to both pay the minimum return, but given the events of this year any investment with capital protection would be viewed very favourably by virtually any investor.
Tags: Valuations Structured EdgeA version of this article has also appeared on www.structuredretailproducts.com