FTSE Autocalls - plotting the recovery
This study continues the analysis we did recently (15 April 2020 and also published on our hub) looking at the effect on UK structured products caused by the sudden stock market falls at the start of 2020.
We showed that at then current FTSE-100 levels (of around 5840 points) that no UK structured product would lose money if the FTSE-100 index did not fall significantly further. All products that are due to mature before 1 January 2022 have at least a further 30% cushion before capital would be lost. This proves that despite significant market falls the risk reducing properties of products issued in the UK retail market have protected investor interests very well.
In this further analysis we will look at the growth prospects of the same set of UK structured products from the current position. Data is correct as at 5 May 2020 when the FTSE-100 closing level was 5853.90.
Protection and growth
One of the intuitive appeals of structured products is the simple separation of capital protection from the potential for positive returns through growth or income. Structured products provide a unique combination of protection and return that no other asset class or product offering can match in the same way.
Structured products can be fully or partly capital protected. Fully protected products look a very smart bet in hindsight this year for lower risk investors and as we have already analysed, those with partial protection have also worked very well in exceptional circumstances.
We need to remember the context which is that direct equity investments are typically sitting on losses of the order of 25% since the start of the year. Because the first priority of structured products is to protect capital and that they are ultimately dependent on equity performance we should expect growth prospects to be a little constrained after the market downturn. It is the purpose of this study to analyse the situation in detail.
Focus on Auto-calls
The most popular product type in the UK structured product market is the Auto-call. These products further divide between growth and income variations. Growth Auto-calls are the more common of these and so we will focus on them in this analysis. Within the family of growth Auto-calls are the “standard” variations, these require the index to be above its start level at a future call date providing a high target return and the lower risk “defensive” and “step-down” versions which will have easier index target levels but generally offer a lower yield.
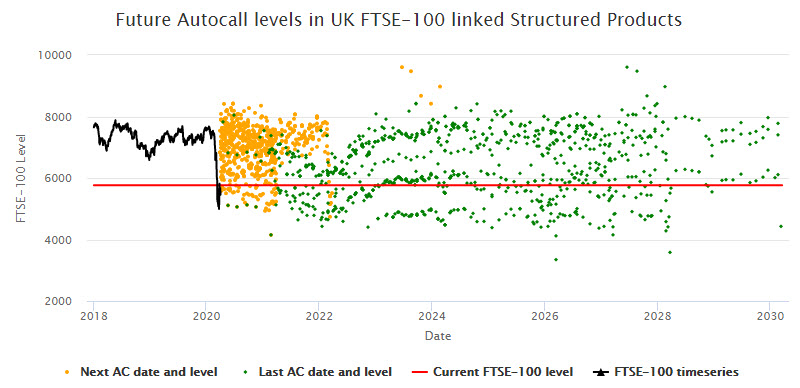
Figure 1: Index performance and future Auto-call dates and levels
Next calls maybe, later calls likely
The chart above shows the recent evolution of the FTSE-100 index (black curve) and a red horizontal line showing its current level. There are 464 live growth FTSE-100 Auto-calls on the Structured Edge database and these are represented on this chart. The orange dots show the date and level of the next Auto-call date and the green dots show the date and level of the last call opportunity for each product.
The next call dates (orange dots) generally occur in the next 12 months and most of them do lie above the red line meaning that the index will need to rise from today’s level for the product to call. This is to be expected as the index is now lower than when most of the products started and set their target levels. The green dots are spread out in the future and many more of them are below the red line. This is because of the defensive and step-down products which are designed for precisely this kind of scenario and feature much lower final call levels, enough to take them below the current FTSE-100 value in many cases.
Future index scenarios and positive returns
In order to analyse what may happen from here we consider a number of scenarios. Firstly we allow for an immediate jump in the index of 200 or 400 points, and independently consider different index growth rates of 5% and 10% p.a.. As a more conservative alternative we also include the case where the index does not increase either initially or over time.
Figure 2: Percentage of products Auto-calling under different assumptions
of initial index jump and future annual growth rates
| Initial index jump (points) | Annualised index growth rate | ||
| 0% | 5% | 10% | |
| 0 | 34.7% | 89.2% | 99.4% |
| 200 | 50.4% | 90.5% | 99.4% |
| 400 | 58.4% | 93.3% | 99.4% |
This table shows (in the first entry) that if the FTSE-100 index stays constant then 34.7% of the products will Auto-call and provide a positive return and the rest will simply return capital. However under more optimistic scenarios of immediate jumps and annualised growth these figures improve dramatically.
To take two examples, an annual growth rate of 5% p.a. means that over 89% of products will call. If instead the index gains 400 points in short order but then fails to show any further gains in the coming years we still see that over half the products (58%) will call successfully.
Figure 3: Average time in years to calling or maturity
| Initial index jump (points) | Annualised index growth rate | ||
| 0% | 5% | 10% | |
| 0 | 5.4 | 3.8 | 2.6 |
| 200 | 5.3 | 3.4 | 2.3 |
| 400 | 5.2 | 3.1 | 2 |
Figure 3 shows the average time that products will be in force until called or reaching final maturity. Under the more optimistic index scenarios not only does the proportion of successful calling increase but also the average time to maturity significantly shortens. This means that investors can make safe their product gains and make a future investment of their choosing.
Figure 4: Average annual performance of Auto-calls
| Initial index jump (points) | Annualised index growth rate | ||
| 0% | 5% | 10% | |
| 0 | 2.4% | 8.4% | 11.2% |
| 200 | 3.5% | 9% | 12.1% |
| 400 | 4.6% | 9.6% | 13.4% |
Finally in figure 4 we see the average annual performance of Auto-calls under these same scenarios.
Over 90% of these products in this set were live at the start of 2020 meaning that they were exposed to the FTSE-100 during this year.
Even if the index remains flat from here the average return will be 2.4% per annum and no products will lose money. It is primarily the defensive and step-down products that contribute in such circumstances. An equity portfolio would simply be down 25% by comparison with no recovery.
If the index starts to show some gains, for example 5% per annum then the average return from the current autocalls will be 8.4% per annum outpacing future index growth and shrugging off the market falls like they never happened. For many observers these are realistic growth rates for the index in the next few years. In this case we again see that returns exceed the index and the market decline this year has not caused any losses.
Conclusions
- In common with all the UK structured products on our database none of the live Auto-calls will lose money if the index does not decline further
- Even if the market moves sideways from here, some defensive and step-down products will pay a return, and the average exceeds cash returns. Compare this to an equity portfolio with losses
- With a modest index rebound or future growth the picture rapidly looks better
- At 5% per year index growth the average Auto-call will absorb this years losses and pay back an average of 8% per annum from here - totally outperforming the FTSE-100
Part 1 of this article, looking at live barriers in the UK market can be found here.
Tags: Special Reports Lifecycle