US market update from StructrPro
The combined database and analytics service StructPro (a joint venture between SRP and FVC) is now fully live and producing regularly updated data for the US market and provides clients with the opportunity to analyse a database of 50000 products in a way that has not been possible before.
Portfolio views for different use cases
An integral part of the service is to allow users to create portfolios or filtered views of the database to drill down into a subset of their choosing. The two main use cases for this are actual client portfolios by CUSIP or looking at a particular market segment, for example income products linked to a chosen index.
Detailed metrics are shown for every portfolio with charts, tables and the ability to examine individual products. Two important charts on the portfolio report show the distribution of product payoff performances and the key levels of underlyings to which products are linked.
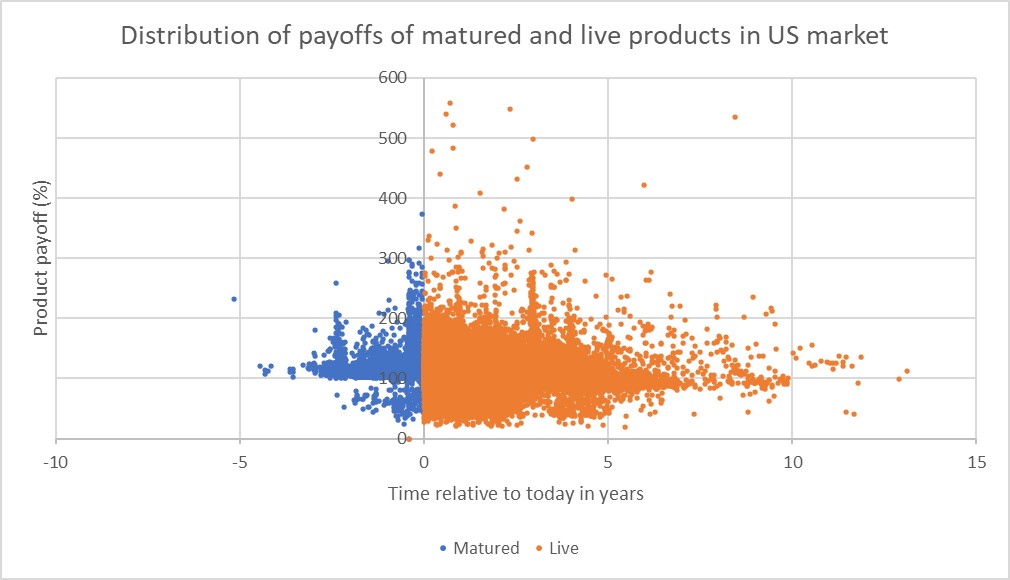
Figure 1: Distribution of payoffs of matured and live products in US market
Combined matured and live products
This chart shows in granular detail the distribution of product payoff performances for both matured and live products on the StructrPro database. The blue markers indicate previously matured products and show the time of maturity relative to today on the x-axis and the total return (coupons and final payment) of each product on the y-axis. The orange markers show live products with the x-axis position being the expected time to maturity (taking into account final market date and any autocall possibilities) and the total valuation made up of previously paid coupons and the current market valuation (independently generated valuations are calculated by FVC for the entire US Structured Product market for the StructrPro service).
The simple divide either side of the current time point illustrates previous and future maturities and this integrated picture of an entire market or a client’s portfolio is one of the central philosophies and features of the StructrPro service.
| Time in years of maturity relative to today | Average actual or predicted payoff | Number of products |
| -2 | 109.11 | 1070 |
| -1 | 108.55% | 5276 |
| 0 | 112.55% | 12344 |
| 1 | 104.73% | 11684 |
| 2 | 104.62% | 7170 |
| 3 | 119.15 | 3866 |
| 4 | 101.5 | 2725 |
| 5 | 96.24% | 1470 |
| 6 | 99.53% | 339 |
Figure 2: Average payoff by maturity year
Performances over time
This table gives a further breakdown of the average payoff (actual or predicted) by year relative to today. It shows that the average performance of matured products is significantly above par indicating a positive return, as can be seen from the chart. The picture of live products is rather more variable. This is partly due to recent market conditions and the equity market sell-off that has affected products this year. Some products will experience a lower market valuation as the combined effect of equity falls and increased volatility since the product started.
However historically it has usually been the case that most of these products will expect to recover to return at least the amount invested. This is due to the risk reducing nature of structured products with their various protection features. It does highlight the need for continued education and explanation from distributors and advisers as to why products can show significant mark to market falls in the short term.
Where’s my risk?
Another useful view for investors is to see the future distribution of key levels for all live products. Any structured product will have one or more of the following levels – strike, autocall, barrier and coupon barrier. It is almost always advantageous to be above these levels, for example to be above the strike to pay upside and above the next autocall level to successfully call. The same is also true for barrier and contingent coupon levels since if the underlying remains above these levels at the relevant time then capital is protected in the case of a barrier or the individual coupon is paid.
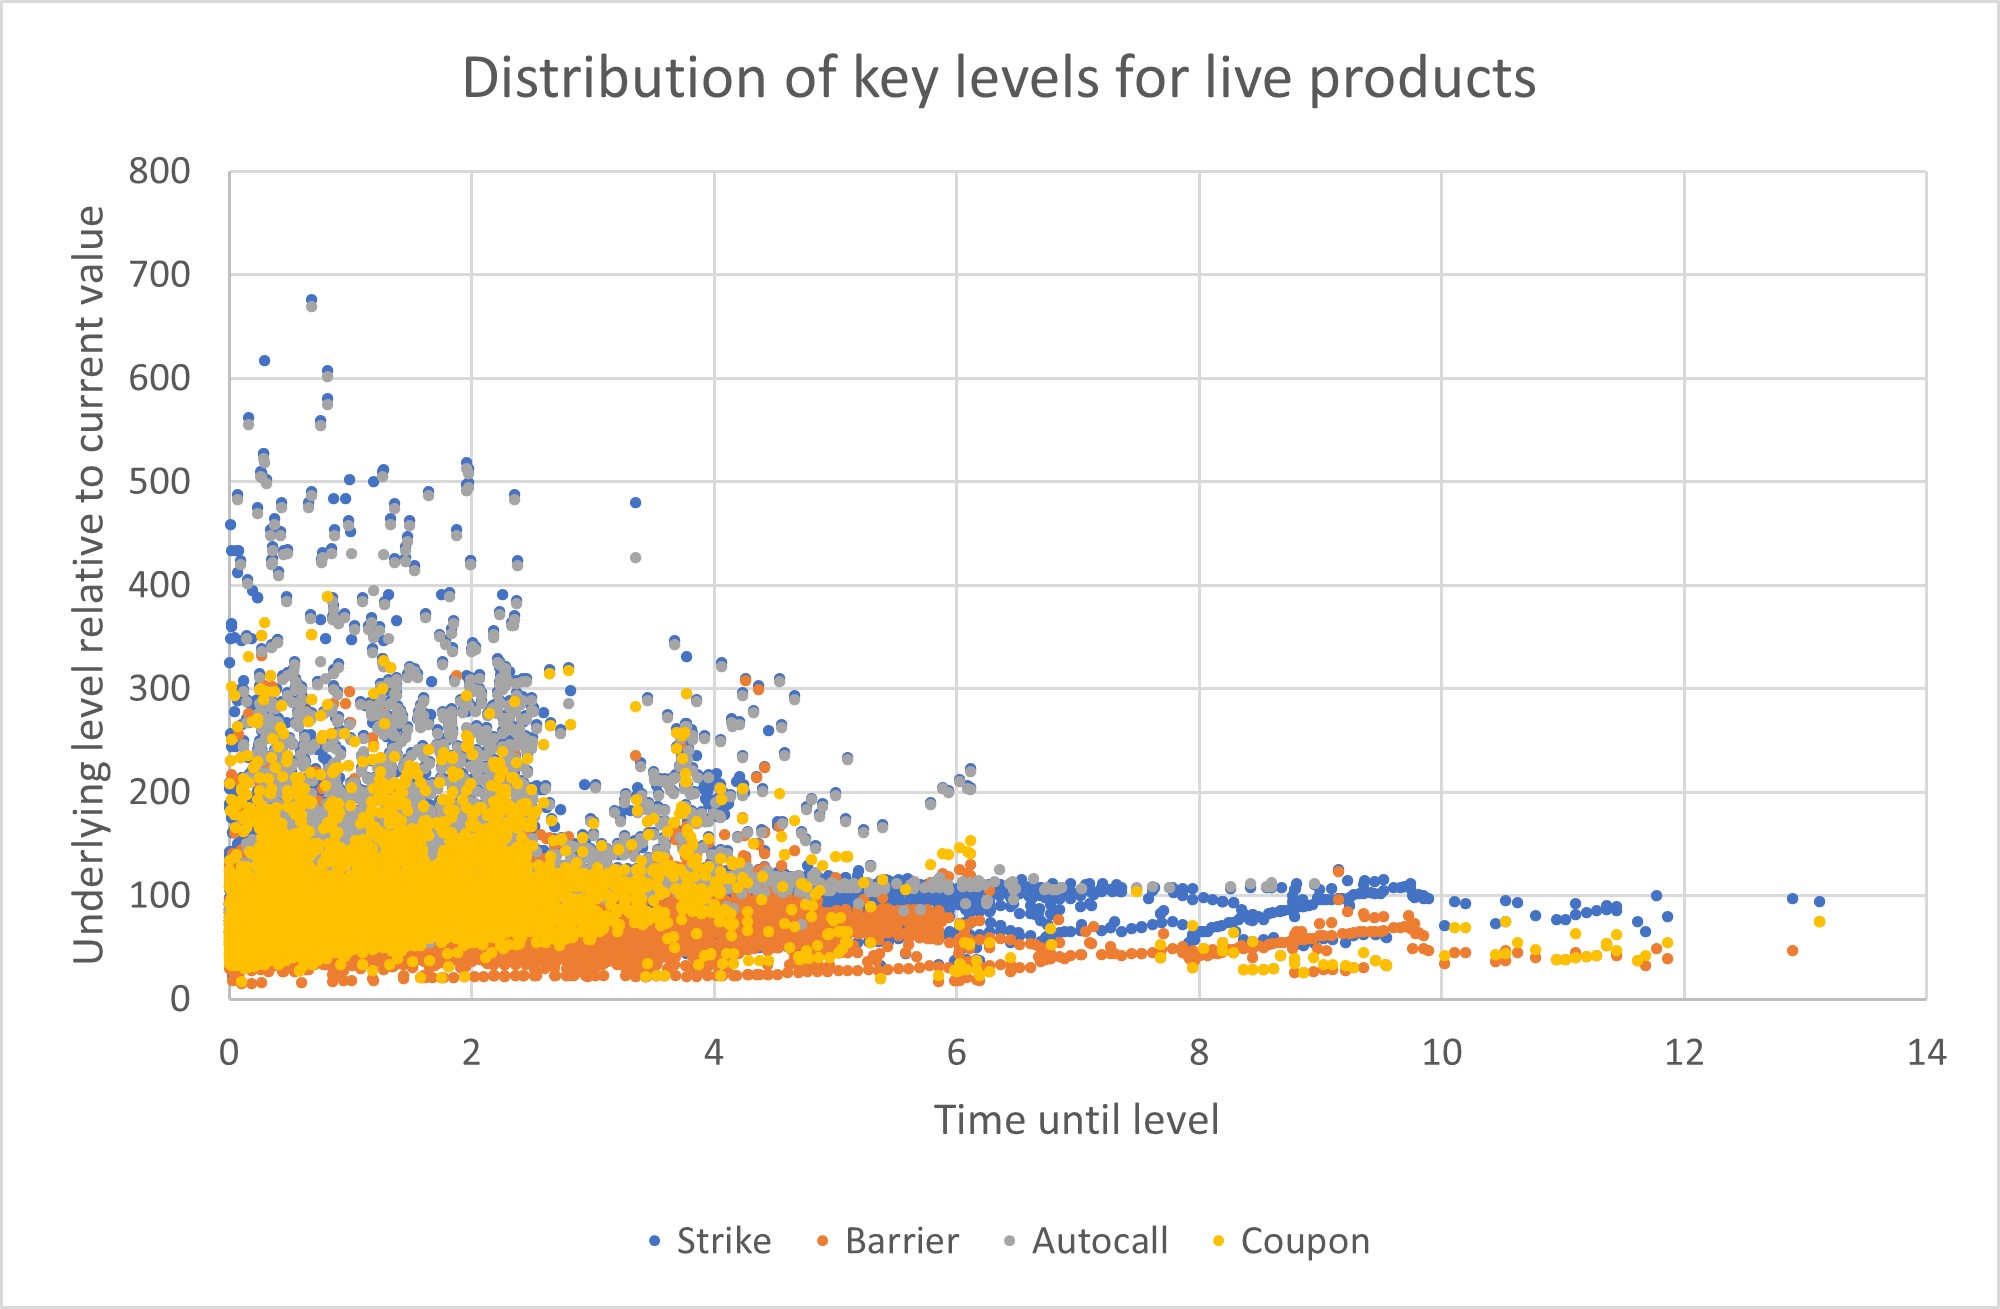
Figure 3: Distribution of key levels for live products
Any of the markers that are below 100% means that if the respective underlying trades sideways or better until maturity then any markers representing barriers will not be breached but an autocall event will be successful and any coupons paid.
As can be seen from the chart, the barrier and coupon markers (in red and orange) are mostly lower than the set of autocall and strike levels.
Further detail can be seen in the table below
| Years to go | Strike | Barrier | Autocall | Coupon |
| 0 | 99.46 | 74.77 | 114.82 | 81.67 |
| 1 | 107.47 | 78.76 | 125.23 | 87.28 |
| 2 | 109.07 | 78.87 | 133.03 | 101.81 |
| 3 | 90.21 | 62.07 | 120.45 | 104.87 |
| 4 | 103.12 | 73.11 | 153.3 | 112.65 |
| 5 | 101.38 | 70.85 | 129.51 | 82.37 |
Figure 4: Breakdown of key levels by years until expected maturity
The distribution of levels varies quite widely into the next few years, this is a combination of different issuance cycles and market movements since the products were issued. Anticipation of future product maturities and events that directly influence product performance is key to analysing any market or portfolio and is made intuitive and convenient with the StructrPro application.
Tags: LifecycleA version of this article has also appeared on www.structuredretailproducts.com
Image courtesy of: Eepeng Cheong / unsplash.com